
Figure 6. The haemodynamic effects of thrombosis (coronary and pulmonary) as demonstrated by echocardiography.
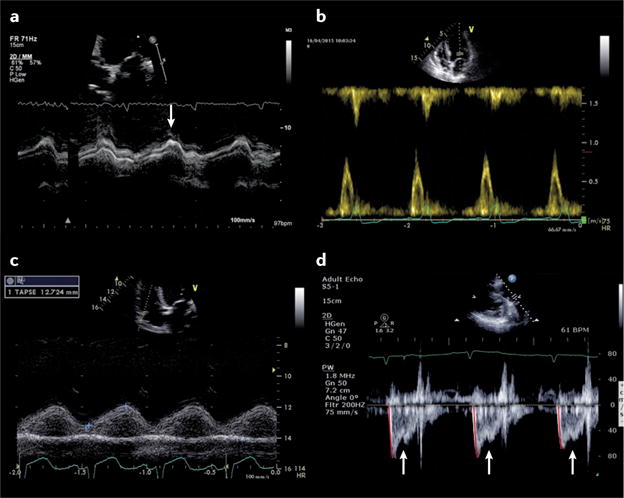
a | Early features of myocardial ischaemia can be demonstrated by the presence of prolonged long-axis shortening, measured by M-mode echocardiography across the base of the left ventricle (post-ejection shortening; arrow). b | Prolonged left ventricular wall tension suppresses early transmitral filling, resulting in an isolated late-diastolic transmitral A wave. c | Increased right ventricular afterload leads to a reduction in right ventricular systolic function, as demonstrated by tricuspid annular plane systolic excursion on M-mode echocardiography across the tricuspid annulus. d | A substantial increase in pulmonary vascular resistance might be associated with a midsystolic notch (arrows) on pulmonary valve pulsed-wave Doppler ejection wave and a short pulmonary valve acceleration time (78 ms; red lines).