Fig. 3.

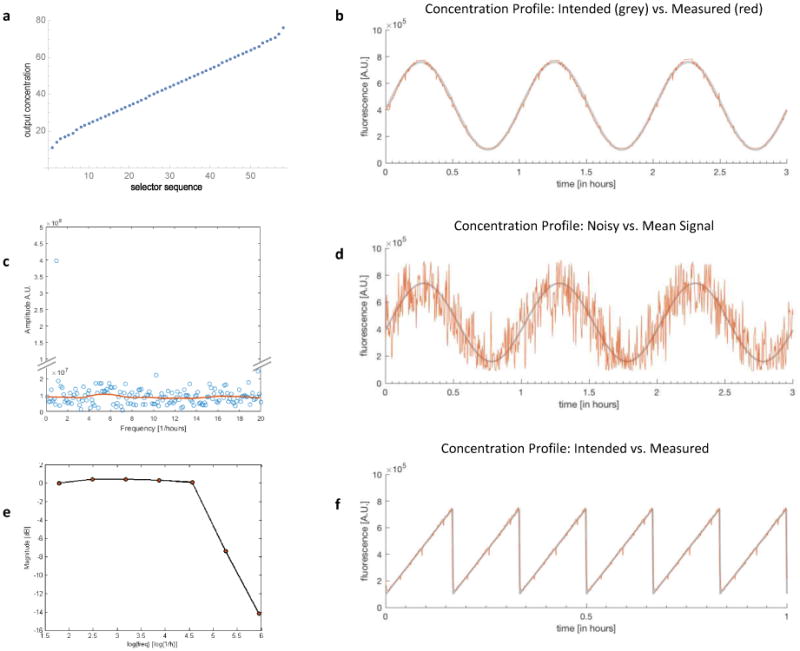
a) Concentration mapping using Fibonacci basis cn = 1, 2, 3, 5, 8, 13, 21, 34. b) Measured FITC fluorescence intensity in the cell culture chamber. Signal generated is a sine wave with period 1 hour (red) and closely follows the intended theoretical signal (grey). c) Blue dots show the Fourier spectrum for the signal shown in Fig. 3d and confirms its white noise property. The red line is the moving window average of the amplitude and was created with the Matlab smooth function. All frequencies are present with approximately the same power except the main frequency with period 1 hour has a larger magnitude. d) FITC fluorescence intensity measured in the cell culture chamber for a generated noisy sine wave with period 1 hour (red) and white noise with standard deviation of 2000pg/ml. The grey line shows the theoretical mean of the sine wave. e) Bode plot shows the cutoff frequency, i.e. when the amplitude of the generated signal in units of dB starts to decrease. f) FITC fluorescence intensity reported in the cell culture chamber for a ramp wave of period 10min (red), which closely follows the intended signal (grey).
