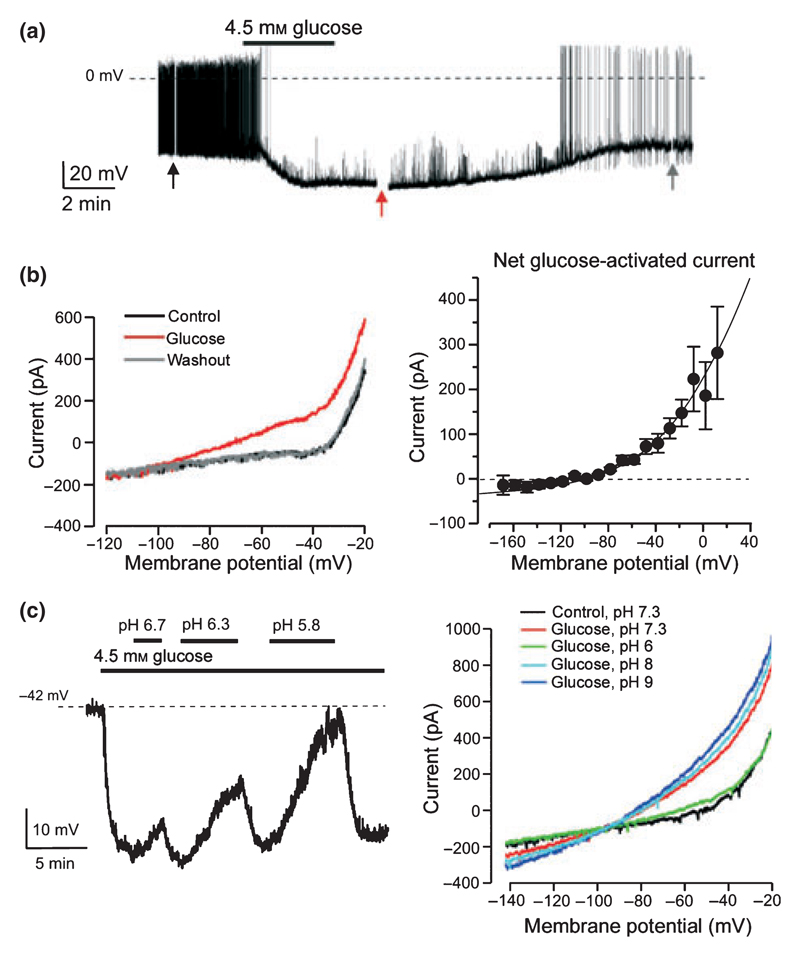
Figure 1. Evidence for glucose-stimulated K+ currents in mouse orexin neurones.
(a) Membrane potential response to an increase in the concentration of glucose from 1 to 4.5 mm. (b) Left, membrane current–voltage relationships during different points of the experiment in (a). Right, net current activated by glucose. (c) Extracellular acidification reverses the effect of glucose on the membrane potential (left) and current (right). Data in (a)–(c) reproduced from Burdakov et al. (2006) with permission from Elsevier.

