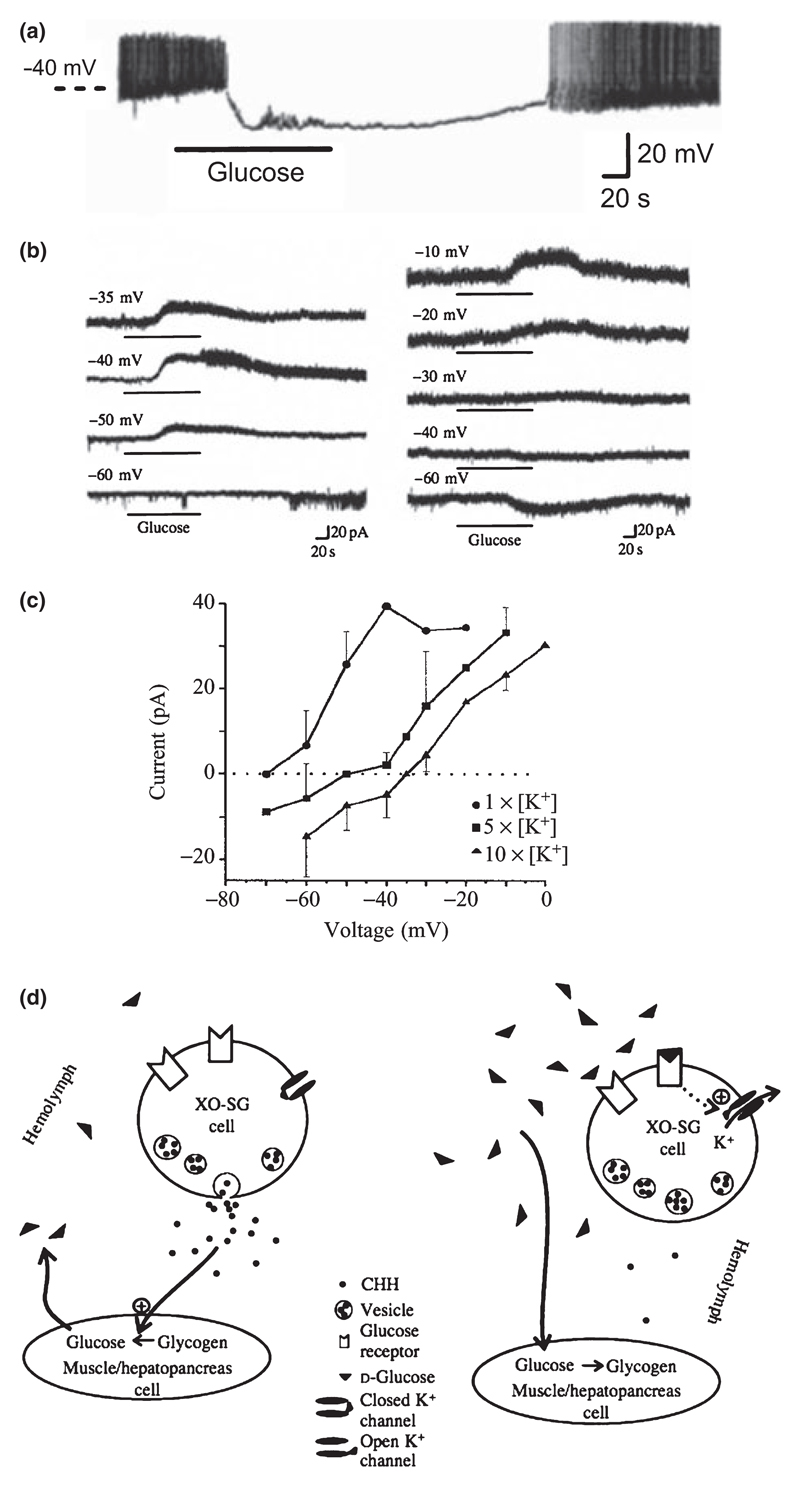
Figure 2. Evidence for glucose-stimulated K+ currents in crab neurosecretory neurones.
(a) Membrane potential response to an increase in the concentration of glucose from 0 to 5 mm. (b) Membrane current response to glucose at different holding potentials. (c) Current–voltage relationship of glucose-induced current (Note: the reversal potential was indistinguishable from that of K+ currents; see Glowik et al. 1997). (d) Hypothetical model of glucose-induced inhibition. (a)–(d) reproduced from Glowik et al. (1997) with permission from The Company of Biologists.

