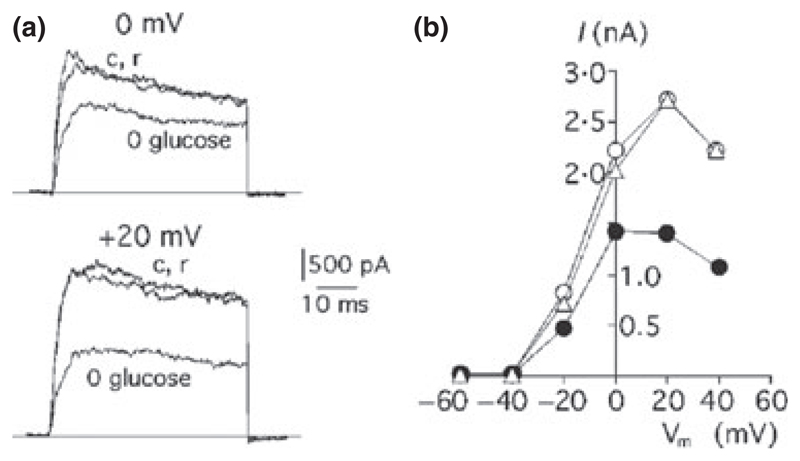
Figure 3. Evidence for glucose-stimulated K+ currents in mammalian carotid body cells.
(a) Membrane current responses to a voltage step from −80 to 0 mV (top) or +20 mV (bottom) in 5 mm glucose (c, control solution), 0 mm glucose and return to 5 mm glucose (r). (b) Relationship between peak outward current and membrane potential in the same cell bathed in control solutions before (5 mm glucose, open circles) and after (5 mm glucose, triangles) exposure to low glucose (0 mm glucose, closed circles). Reproduced from Pardal & Lopez-Barneo (2002), with permission from Macmillan Publishers Ltd: Nature Neuroscience, © 2002.

