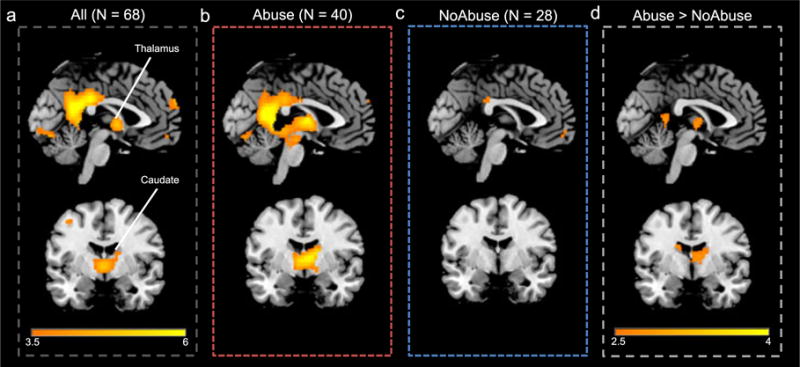
Figure 2.

Example images showing brain response (threshold: 3.5 < t < 6, coordinates: x =−2, y =−4) to drug (versus neutral) cues for the entire sample, and for the Abuse and NoAbuse subgroups (for the first half of the task). a) The overall group (N = 68) responded to drug cues in several nodes of the ROI mask striatum, midbrain and thalamus. b) This overall pattern was evident in individuals history of abuse (N = 40), c) but was lacking* in individuals without a history of abuse (N = 28). d) Comparing Abuse versus NoAbuse (threshold p < 0.01), the participants with a history of abuse had a greater response to drug cues in the first the thalamus and the caudate. *Also see Figure S1 for the pattern of responding in the NoAbuse group at a reduced threshold
