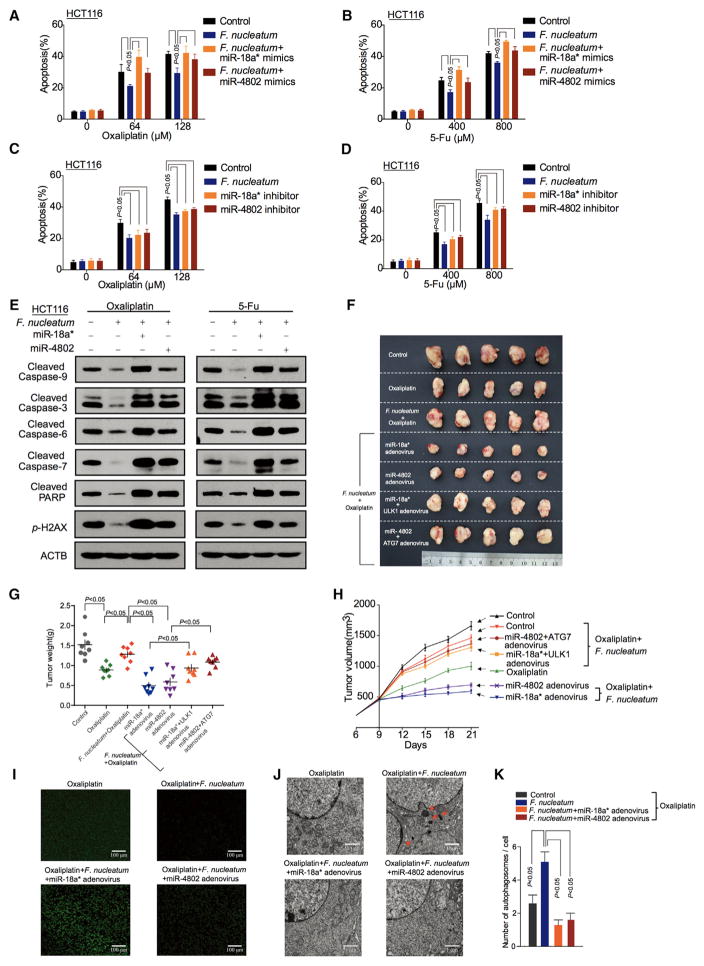
Figure 5. miR-18a* and miR-4802 Regulate F. nucleatum-Mediated Chemoresistance.
(A–D) Apoptosis was detected by flow cytometry in HCT116 cells. HCT116 cells were transfected with mimics (A, B) or inhibitors (C, D) of miR-18a* and miR-4802, co-cultured with F. nucleatum, and treated with different concentrations of Oxaliplatin (A, C) and 5-FU (B, D). nonparametric Mann–Whitney test.
(E) Western blot was performed in HCT116 cells. HCT116 cells were transfected with mimics or inhibitors of miR-18a* and miR-4802, co-cultured with F. nucleatum, and treated with different concentrations of Oxaliplatin (left) and 5-FU (right).
(F) Representative data of tumors in mice under different conditions. Figure 5(F) and Figure S5G shared experimental controls.
(G and H) Statistical analysis of tumor weights (G) and volumes (H) in different groups, n = 8/group nonparametric Mann–Whitney test.
(I) TUNEL assays were performed to detect tumor cell apoptosis in xenograft tumor tissues. The mice received different treatments.
(J) Transmission electron microscopy was performed to show the autophagosomes in xenograft tumor tissues. The mice received different treatments (17500 × magnification). Bar scale, 1 μm.
(K) Statistical analysis of autophagosomes. Autophagosomes were detected by transmission electron microscopy in xenograft tumor tissues, nonparametric Mann–Whitney test.
See also Figure S5–6.

