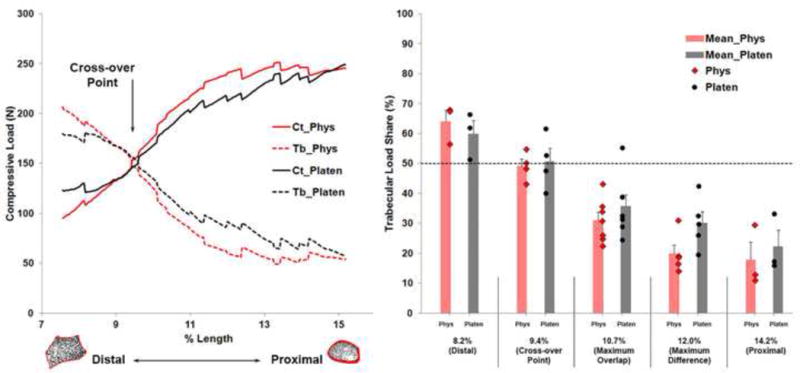
Figure 4.

Average cortical (Ct) and trabecular (Tb) load share compared between the physiologic (Phys) and platen-compression (Platen) analyses plotted along the length of the reference specimen (Left). Data from nine specimens were grouped relative to the reference specimen. Shown is the cross-over point where cortical-trabecular load sharing was equal. Trabecular load share compared at specific locations along the length of the reference specimen indicating between-specimen variability (Right). Error bars indicate standard error. Dashed line indicates 50% load share. Cortical load share (not shown) can be calculated as 100 minus trabecular load share.
