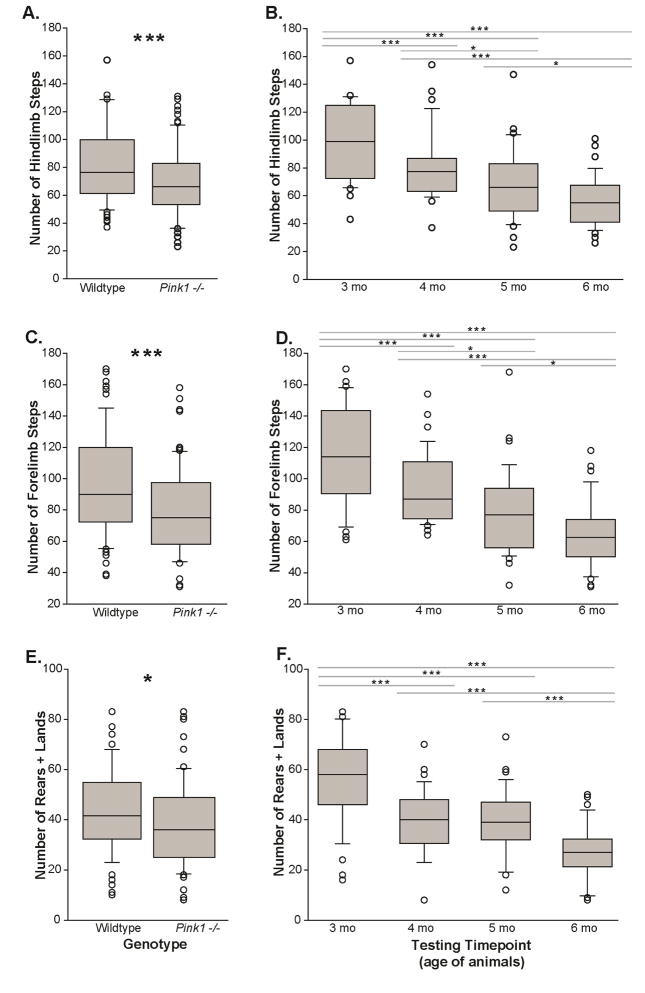
Figure 4. Cylinder locomotor activity test.
The number of hindlimb steps in the cylinder (A) between genotypes and (B) across data collection timepoints (corresponding to age of the animals; 2–6 months; main effect of time). The number of forelimb steps (C) between genotypes and (D) across timepoints. The number of rears + lands; main effect between (E) genotypes and main effect (F) across timepoints. X-axis is testing the genotype or timepoint/animal age (mo); Y-axis is number of steps. The boundary of the box closest to zero indicates the 25th percentile. The line within the box marks the median and the boundary of the box farthest from zero indicates the 75th percentile. Whiskers (error bars) above and below the box indicate the 90th and 10th percentiles. Outlying points are indicated by open circles. Asterisks represents statistical significance between genotypes (* p<0.05; ** p<0.01, ***p<0.001). Bars indicate significance between timepoints with asterisks showing levels of significance (* p<0.05; ** p<0.01, ***p<0.001).

