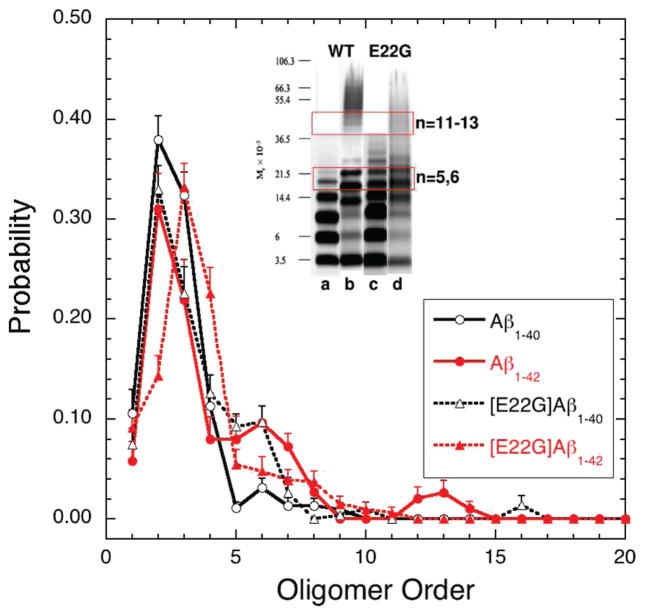
Figure 4.
Oligomer size distributions for Arctic mutants [E22G] Aβ1–40 (dotted black curve) and [E22G] Aβ1–42 (dotted red curve) obtained by DMD simulations using the four-bead protein model at T = 0.130. Each distribution is an average over eight 20 × 106 simulation steps long trajectories. The oligomer size distributions for Aβ1–40 (solid black curve) and Aβ1–42 (solid red curve) are shown for comparison. All conformations for time frames of 19 × 106, 19.5 × 10⁶, and 20 × 106 simulation steps were included in the analysis. Each trajectory involved 32 peptides, initially spatially separated and each in random coil conformation, enclosed in a 25-nm-length cubic box. The error bars represent SEM. The inset adapted from Bitan et al.13 shows the experimental data obtained by PICUP/SDS-PAGE for (a) Aβ1–40, (b) Aβ1–42, (c) [E22G] Aβ1–40, and (d) [E22G] Aβ1–42.

