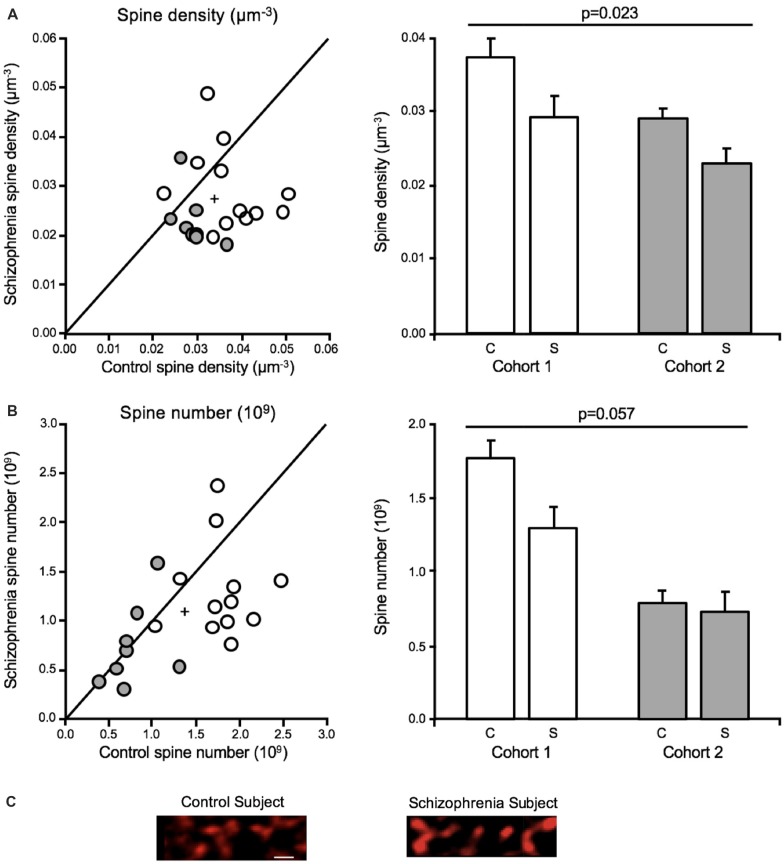
Figure 4.
Dendritic spine alterations in deep layer III in A1 in schizophrenia (Shelton et al., 2015; MacDonald et al., 2017). For scatterplots: Cohort 1 is denoted by open circles, Cohort 2 is denoted by closed gray circles, the group mean is indicated by the cross, and the line represents schizophrenia = unaffected comparison subject values. For bar graphs: C denotes unaffected comparison group, S denotes schizophrenia, and error bars are ± SE. (A) Assessment of cohorts 1 and 2 revealed mean dendritic spine density was reduced in deep layer III in A1 in schizophrenia. (B) Mean spine number was also found to be significantly reduced in deep layer III in A1 in schizophrenia. (C) Representative micrographs of phalloidin-labeled objects from one pair comprising one unaffected comparison case and one schizophrenia case revealing putative dendritic spine loss in A1 in schizophrenia. Scale bar = 1 μm.

