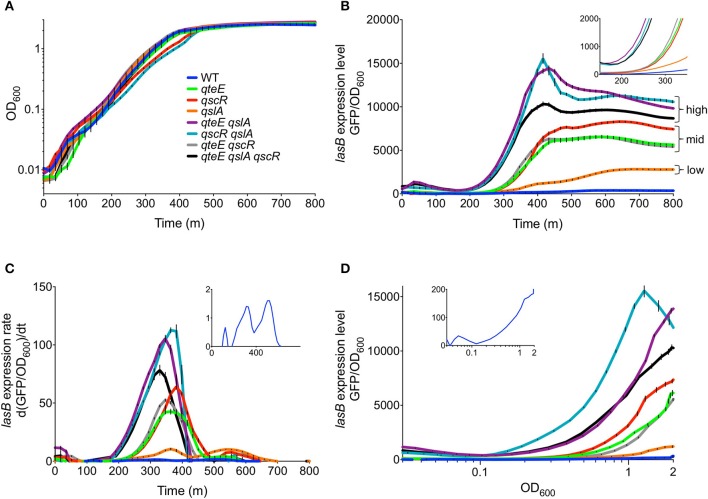
Figure 2.
Effects of anti-activator gene deletion on PlasB-gfp expression kinetics. (A) Growth of strains in CAA medium. (B) PlasB-gfp expression levels vs. time. Expression levels are normalized to OD600. Inset has reduced x- and y-axes to emphasize expression timing. (C) PlasB-gfp expression rates vs. time, showing time derivatives of OD-normalized expression levels. Inset has a reduced y-axis to emphasize expression rate peaks in the wild-type. (D) OD-normalized PlasB-gfp expression levels vs. cell density. Inset has a reduced y-axis to emphasize the wild-type expression profile. In all panels, values represent means of three biological replicates. Error bars indicate s.e.m. (n = 3).

