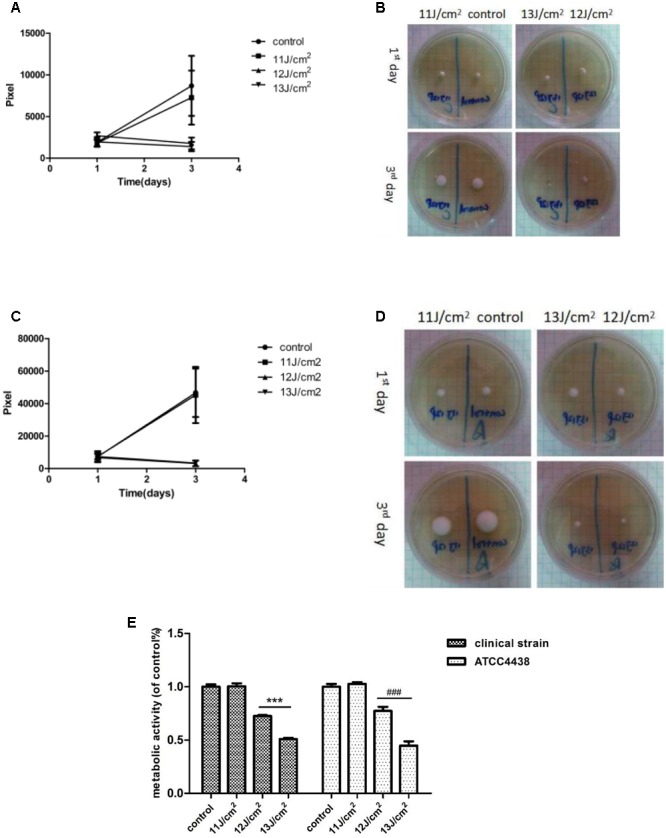
FIGURE 2.

Growth of T. rubrum at different light doses of IPL treatment. (A,B, clinical strain; C,D ATCC4438). (A) Is a pixel line chart based on the samples in (B) (clinical strain). (C) Is a pixel line chart made based on the samples in (D) (ATCC4438). (E) Fungal viability was evaluated by MTT assays 6 h after IPL treatments. The data are reported as the mean of six independent experiments. ∗∗∗P < 0.001 vs. untreated clinical strain, ###P < 0.001 vs. untreated ATCC4438.
