Figure 4.
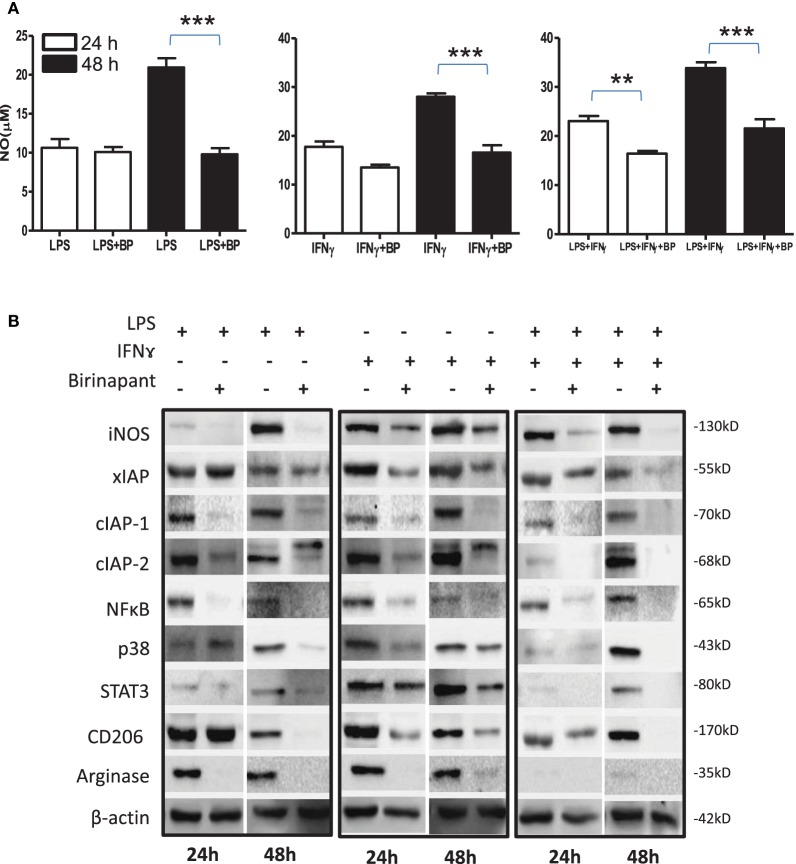
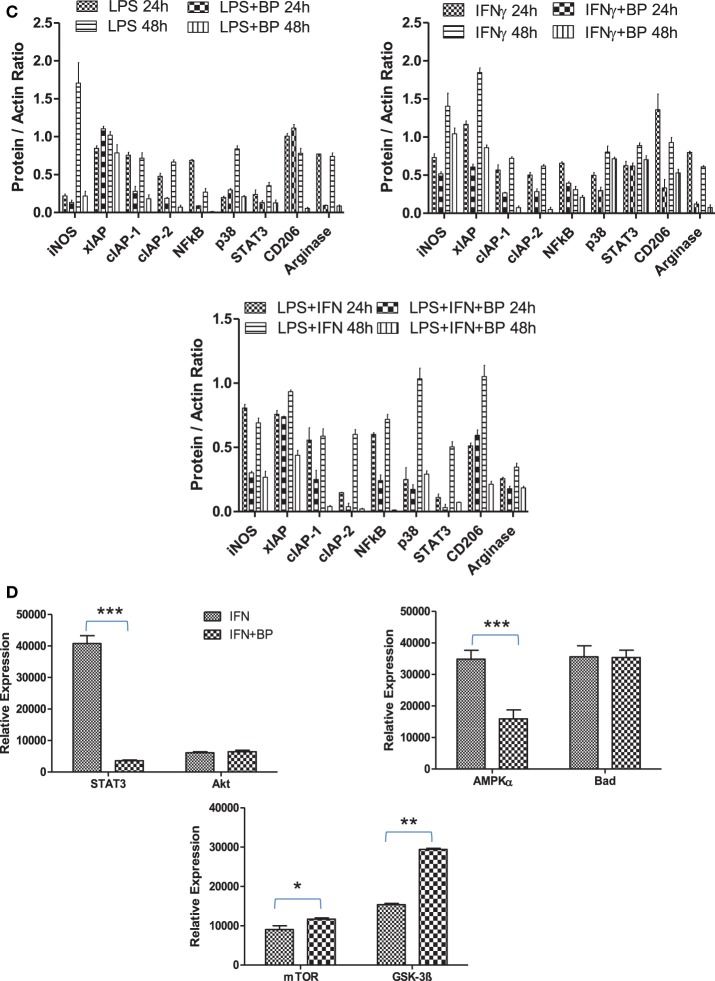
Birinapant regulate M1 programming and immune-metabolic programming in lipopolysaccharide (LPS) and/or IFNγ-skewed iNOS+ macrophages. RAW264.7A murine MΦ was stimulated with Th1 cytokines LPS or IFNγ and both LPS and IFNγ with and without birinapant and cultured for indicated time points. (A) NO titer was quantified in the culture supernatants by the Griess reagent method. The data are represented as mean μM of NO ± SEM, and statistical analysis was conducted using two-way ANOVA followed by the Bonferroni post-test (*p < 0.05; **p < 0.01; and ***p < 0.001). (B) The cultures mentioned under (A) were lysed and analyzed for various M1 and M2 effector proteins, inhibitors of apoptosis proteins, and signaling markers by Western blotting. (C) The Western blots were quantified for densitometry by Image J software, and mean densitometry values of independent proteins were divided with its mean densitometry values of its respective β-actin band intensity value to present the relative expression of each protein as a mean in the ratio of protein to actin. (D) To monitor the intracellular signaling, important metabolic signaling component activation was observed using PathScan Intracellular Signaling Array Kit from Cell Signaling Technology. Images were analyzed by using ImageJ software, and mean densitometry values were plotted in terms of relative expression. Statistical analysis was conducted using two-way ANOVA followed by the Bonferroni post-test (*p < 0.05; **p < 0.01; and ***p < 0.001).


