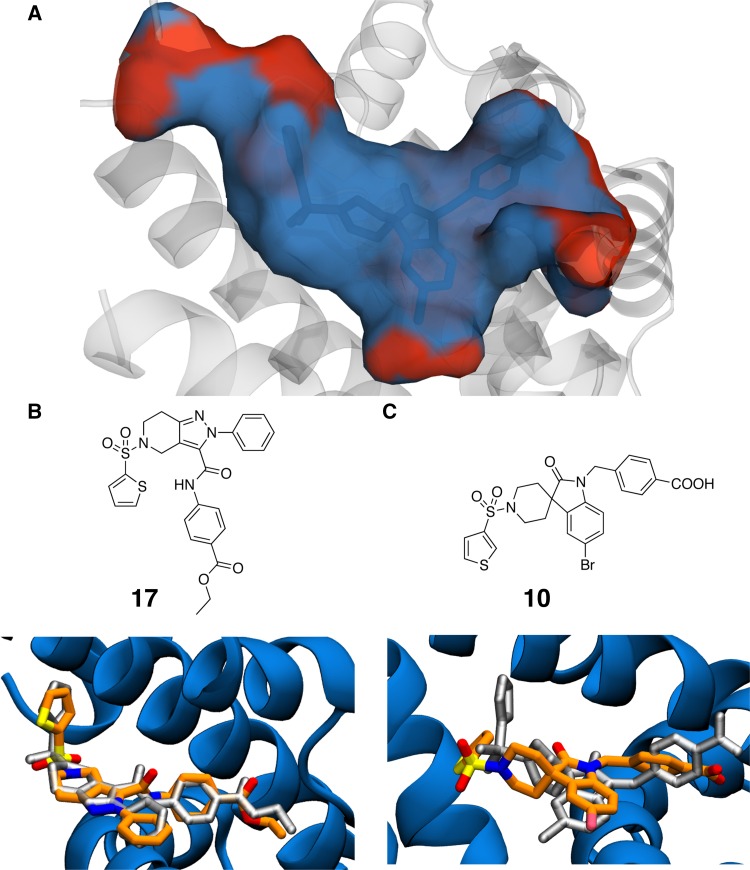
Fig. 2.
a Depiction of the FXR binding site, with hydrophilic residues shown in red and hydrophobic residues shown in blue. b Compound 17 from set1, and predicted (orange sticks) versus observed (grey sticks) binding modes. c Compound 10 from set2, and predicted (orange sticks) versus observed (grey sticks) binding modes

