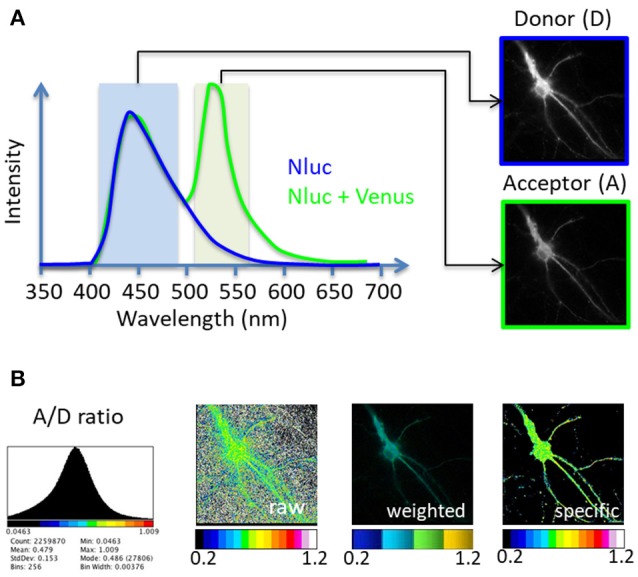
Figure 1.

Principle of the BRET-Analyzer toolset. The BRET-Analyzer toolset provides automatic analyses of donor (D) and acceptor (A) images (A) to generate a quantitative analysis of the specific A/D ratio image (B). (A) Scheme of two BRET donor compatible entities emission spectra: Nanoluciferase (Nluc) is the BRET donor and Venus the BRET acceptor. The light emitted by the donor alone displays an emission pic at 450 nm (blue curve). When Venus is co-expressed and close enough (<75Å) from Nluc, a non-radiative transfer of energy from Nluc excites Venus, which emits light at its characteristic wavelength (pic at 535 nm, green curve). Light collected with specific filters gives rise to donor and acceptor images. (B) Distribution of the A/D ratio pixel values and possible representations of the BRET images: A stack histogram (left panel) displays the distribution of the A/D ratio values obtained from pixel by pixel division of the A image over the D image, suggesting the minimal and maximal values to be set on the pseudo-color scale expressing the A/D ratio image. “Raw,” “weighted” and “specific” panels are three possible representations of the A/D ratio image. The “raw” image expresses the ratio as pseudo-colors, without any selection of pixels. Consequently, pixels with a near-zero intensity on the D image display a maximal A/D ratio, compromising the detection of pixels from the specimen. Alternatively, the “weighted” ratio also displays the A/D ratio intensity as pseudocolors, but the brightness of each pixel is proportional to the donor intensity. This representation shades the ratio background around the cell but also the specific signal coming from low protein expression level in sub-cellular area. The BRET-Analyzer toolset allows obtaining the “specific” ratio by an automatic selection of pixels from the specimen only (obtained by composite thresholding of the D image). The “specific” image displays the intensity of the A/D ratio expressed as pseudo-colors, regardless of protein expression levels.
