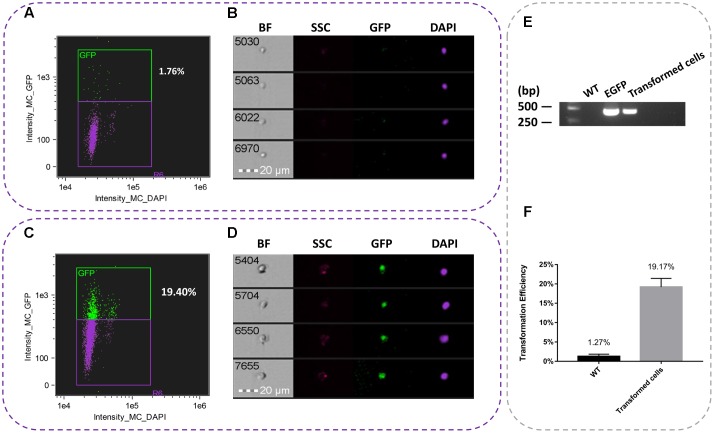
FIGURE 2.
Representative pictures of single nuclei after transformation. (A) Percent of egfp in WT suspension cells. (B) The nuclei image of untransformed WT suspension cells. (C) Percent of egfp in transient cell suspensions. (D) The nuclei of transient suspension cells. (E) PCR analysis of transformed suspension cells from T. wilfordii. PCR fragments amplified from the pBI1300-EGFP primers. (F) Transformation efficiency of transient and WT cell suspensions.

