
FIGURE 6.
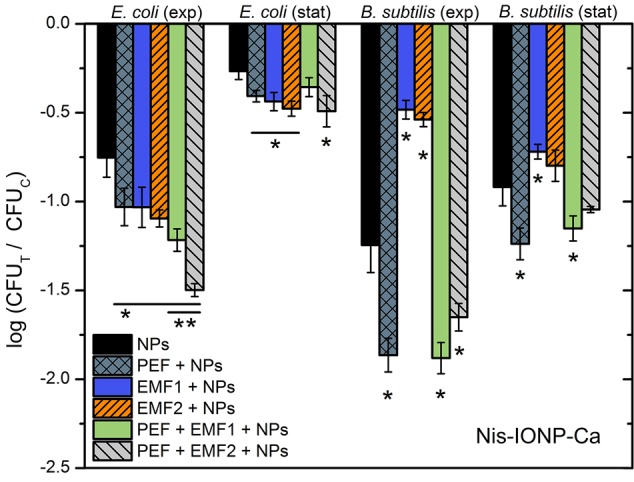
Inactivation of E. coli and B. subtilis using different treatment protocols and nisin-loaded iron oxide NP with Ca as a capping agent (Nis-IONP-Ca), where PEF – 10 kV cm-1 × 8 × 100 μs; EMF1 – 3.3 T × 50, 0.25 Hz; EMF2 – 10 mT, 100 kHz, 2 min. The number of residual culturable cells in the samples after the PEF treatment (CFUT) was compared with ones in the control samples without treatment (CFUC). The asterisk (∗) represents statistically significant (P < 0.05) difference versus NPs only treatment. The asterisk (∗∗) represents statistically significant (P < 0.05) difference versus PEF + NPs treatment.