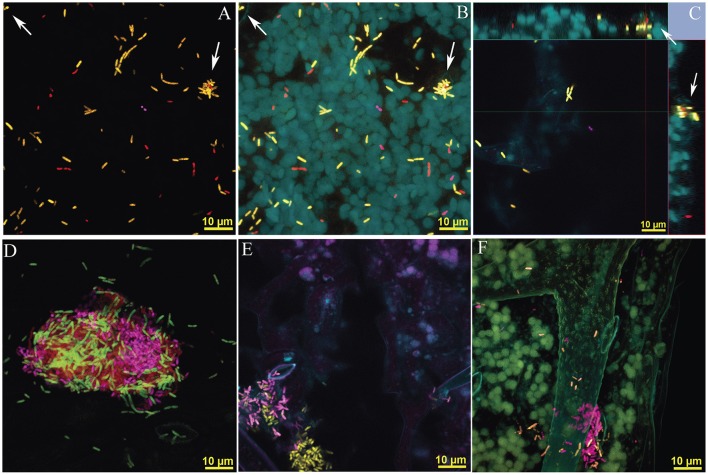
Figure 3.
Imaging of mixed microbial aggregates on the leaf surface and immediate subcuticle area of in vitro grown Arabidopsis leaves incubated with Sphingomonas, Methylobacterium and Pseudomonas. All confocal images were generated using a 100 X lens, Zeiss LSM780 and processed using spectral unmixing. Methylobacterium and Pseudomomas are labeled with a combination of probes (EUB338 I, II, and III and mybm-1388 or PSE227), and are false colored in pink and yellow respectively. Sphingomonas is only labeled with EUB338 I, II and III and shown in red. FISH EUB338 I, II, and III conjugated with rhodamine, mybm-1388 with Alexa-488, and PSE227 with Alexa-647. (A–C) Correspond to different processing of an Z-stack image, 16 confocal images, 1 μm apart. Stomatas are signaled with arrows (A) 3-D image generated using only layers identified as specific fluorescence emission of general and taxa-specific bacterial probe(s) (Figure S5 for fluorophore specific decomposition). In plate (B) plant autofluorescence is incorporated as an additional layer to the 3D image (C) Ortho projection of Z-stack images, 15 μm depth. Bacteria are distributed in peaks and groves of the plant surface, so only a few cells are visible in a single plane. Arrows signal cells inside the stomatic chamber. Main image corresponds to Z = 0 (see Video S3 in Supplementary Material) (D) Aggregate formed by cells identified as Methylobacterium, Pseudomonas and Sphingomonas. (E) Image showing Pseudomonas and Methylobacterium adhaesivum B5A near stomata. (F) Pseudomonas and Methylobacterium adhaesivum B5A forming aggregates on an Arabidopsis trichome, 15 Z-Stack images total depth of 14 μm. In all panels, yellow bar, 10 μm.

