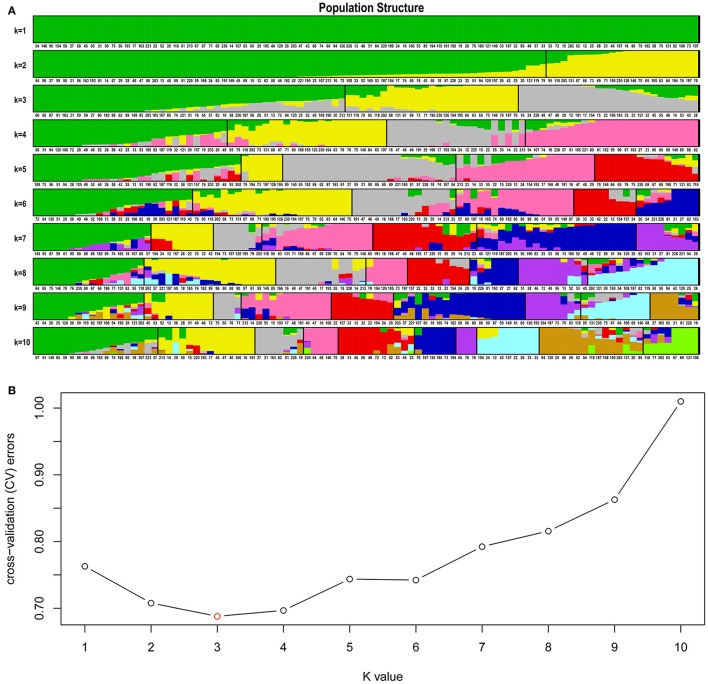
Figure 1.
Cluster analysis and population structure of 224 germplasm resources of flax. (A) Cluster map of the population structure (each color represents a cluster, and each row represents the result of a given number of clusters (K, K = 1–10); (B) Population structure plot [ordinate represents cross-validation error rate (CV-value); abscissa represents number of clusters (K)].

