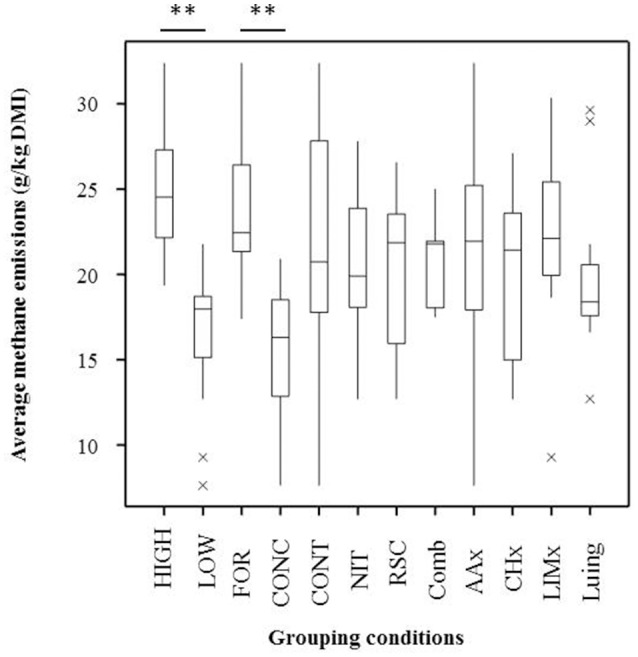
Figure 1.

Boxplots representing methane emissions under different conditions. High, High methane emitters (n = 25); Low, Low methane emitters (n = 25); FOR, Forage (n = 34); CONC, Concentrate (n = 16); CONT, all controls (n = 20); NIT, all samples with nitrate (n = 12); RSC, all samples with supplementary lipid (n = 12); Comb, all samples with nitrate and supplementary lipid (n = 6); AAx, all samples from Aberdeen Angus (n = 13); CHx, all samples from Charolais (n = 12); LIMx, all samples from Limousin (n = 13); Luing: all samples from Luing (n = 12). **P < 0.01.
