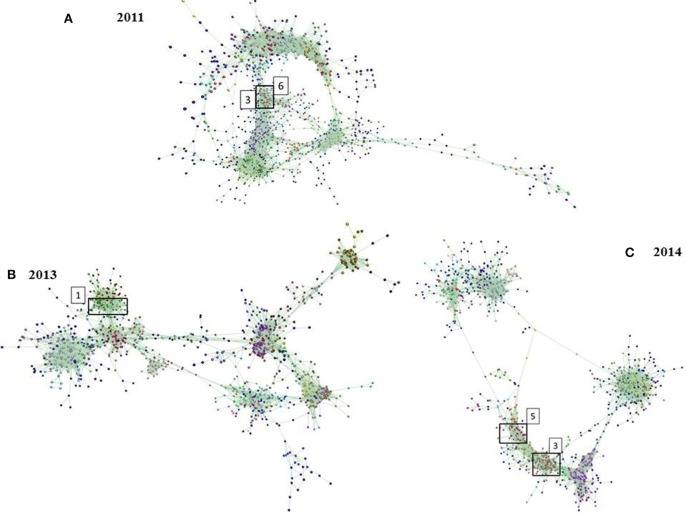
Figure 4.
Functional clusters of microbial genes identified using network analysis for (A) the 2011 experiment (n = 1424 genes), (B) the 2013 experiment (n = 1178 genes), (C) the 2014 experiment (n = 1224 genes). Correlation analysis of microbial gene abundance was used to construct networks, where nodes represent microbial genes and edges the correlation in their abundance.

