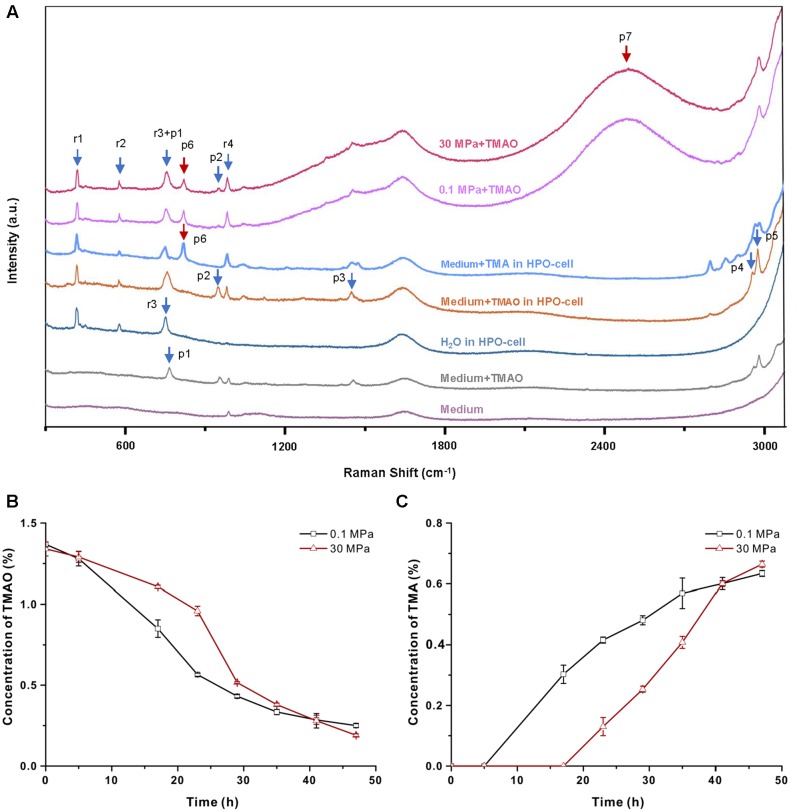
FIGURE 3.
Raman spectrometry analysis of the utilization of TMAO. (A) Raman spectra of different solutions. From the bottom to top: minimal medium on slide, minimal medium with 1% TMAO on slide, water in HPO-cell, minimal medium with TMAO in HPO-cell, supernatant of QY27 cultured at 0.1 MPa and supernatant of QY27 cultured at 30 MPa. Arrows mark the TMAO-specific peaks (p1–p5), product of TMAO metabolism (p6 and p7) and unrelated peaks (r1–r4). (B) The concentration of TMAO in the supernatant of QY27 cultures at 0.1 MPa and 30 MPa. The concentration of TMAO was calculated by the ratio of peak area of p2/r4. (C) The concentration of TMA in the supernatant of QY27 cultures at 0.1 and 30 MPa. The concentration of TMA was calculated by the ratio of peak area of p6/r4.

