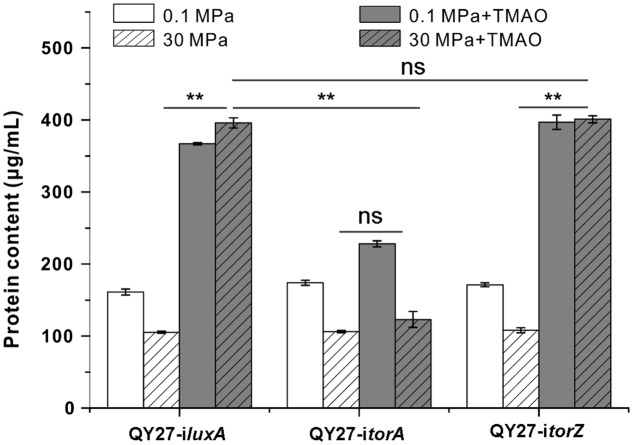
FIGURE 5.
Contribution of TMAO reductase isozymes on the growth of QY27 at different conditions. The growth of QY27 carrying control plasmid (QY27-iluxA), torA-silencing strain (QY27-itorA) and torZ-silencing strain (QY27-itorZ) at different conditions. The blank and gray bars represent cultures at 0.1 and 30 MPa without TMAO, the white and gray bars with slash represent cultures at 0.1 and 30 MPa with TMAO, respectively. The biomasses were measured in the stationary phase. The Student’s t-test was performed, ∗P < 0.05, ∗∗P < 0.01, ∗∗∗P < 0.001, and ns represents no significant difference.

