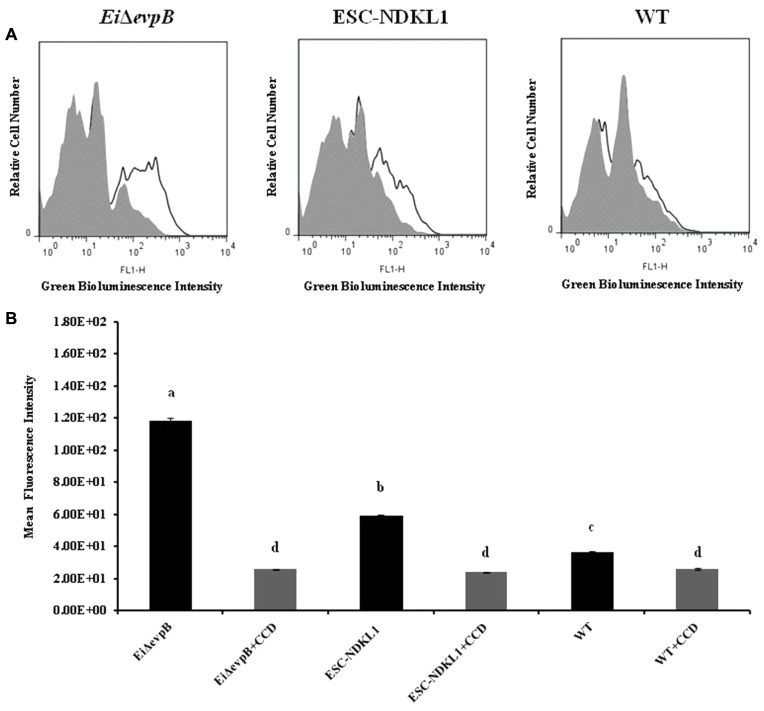
FIGURE 1.
Active phagocytic uptake of EiΔevpB and ESC-NDKL1 strains in catfish peritoneal macrophages. (A) Original flow data by using overlay histogram statistics: Black line histograms indicate uptake of the LAVs and WT strains at 32°C. Gray histograms indicate antigen uptake in the presence of CCD at 32°C. (B) Statistical analysis of the phagocytic uptake mean of fluorescent intensity (MFI). Black filled columns in the graph show MFI of LAVs and WT strains uptake at 32°C. Gray filled columns show MFI of antigen uptake in the presence of CCD at 32°C. The data represent the mean of MFI of macrophage phagocytic uptake from five fish ± SD. The letters (a,b,c,d) show the significant differences between treatments (P < 0.05).

