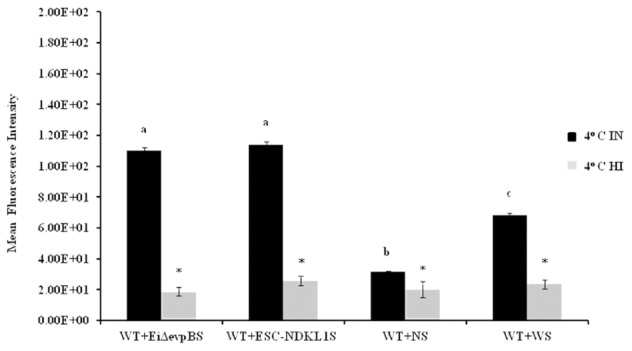
FIGURE 4.

Active uptake of E. ictaluri LAVs opsonized with IN and HI sera from challenged fingerlings in catfish peritoneal macrophages at 4°C. a,b,cPresence of letters on top of bars indicates treatment differences in the uptakes with bars with different letters being different from each other and from bars without a letter designation (P < 0.05). ∗Indicates treatment differences in the uptakes (P < 0.05). The data represent the mean of MFI of macrophage phagocytic uptake from five fish ± SD.
