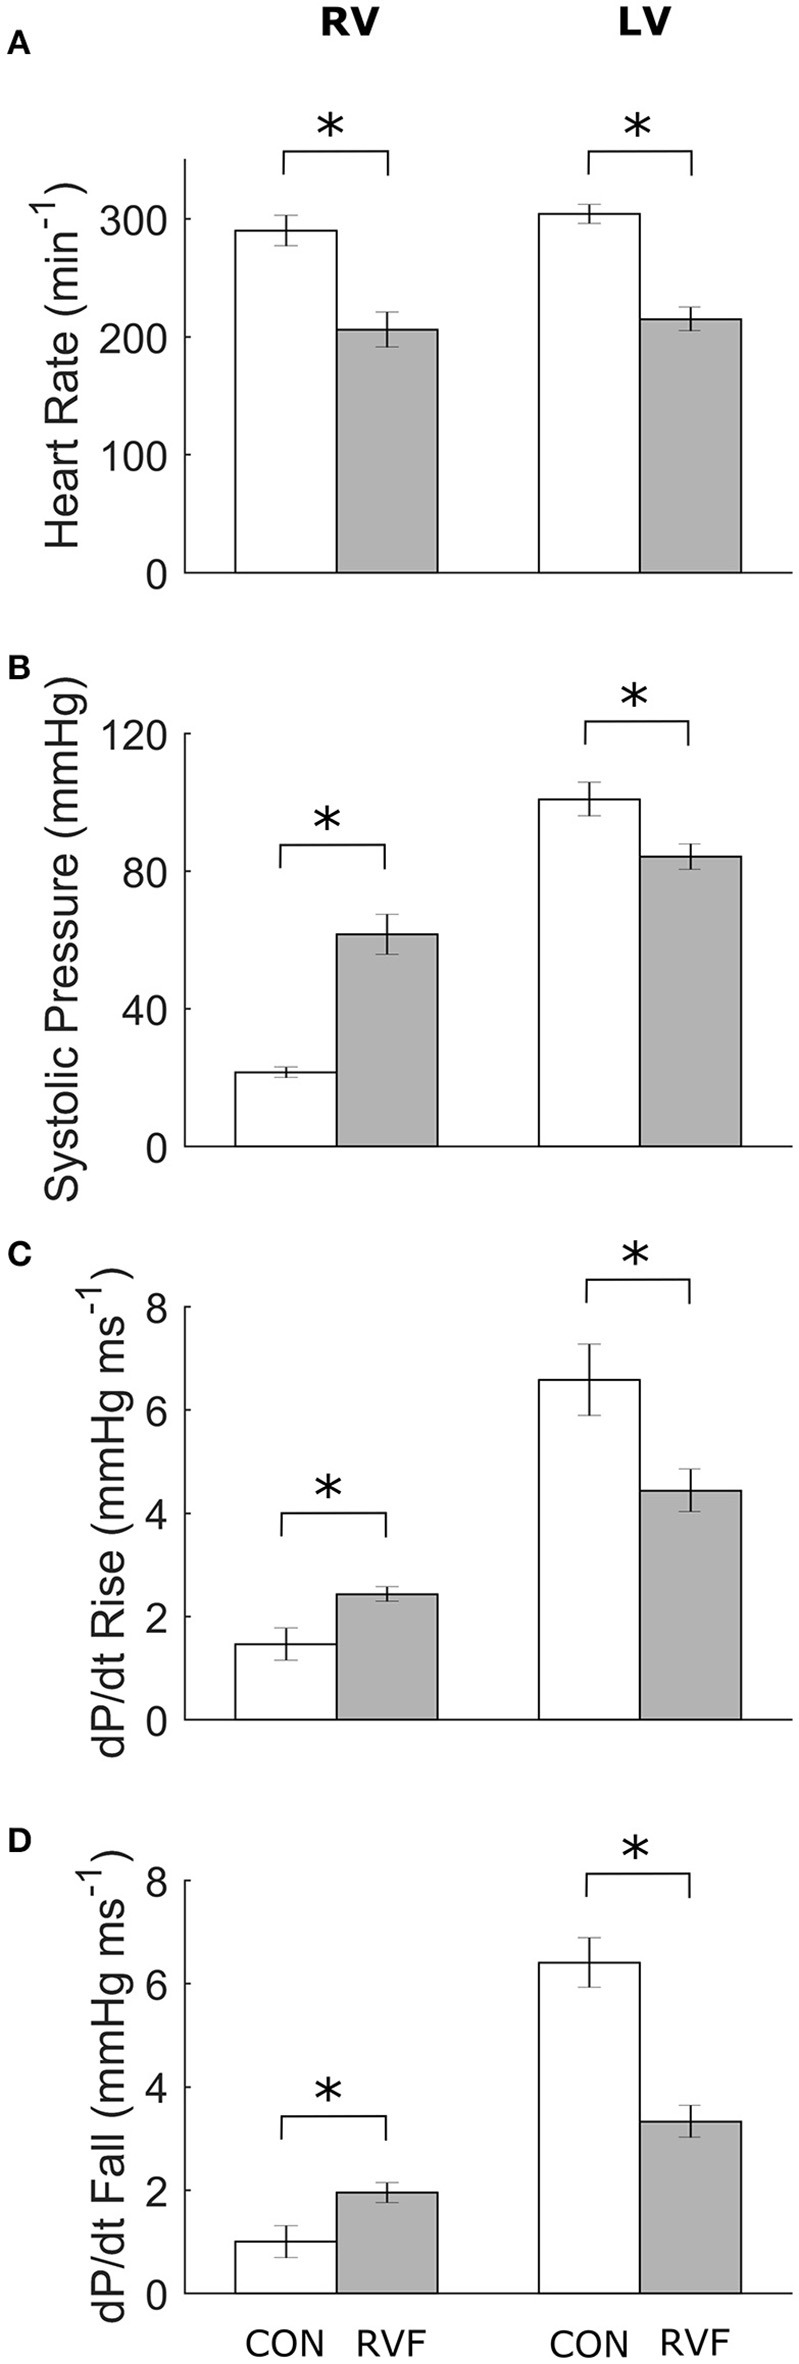
Figure 2.

Mean ± SE in vivo heart rates and pressure of the ventricles of control and right-ventricular failing rats at Week 6. Data obtained from the right ventricle (4 Control and 5 RVF rats) and the left ventricle (5 Control and 7 RVF rats). Significant differences (*P < 0.05) between rat groups were observed in heart rate (A), systolic ventricular pressure (B), and the rates of rise (C) and fall (D) of ventricular pressure.
