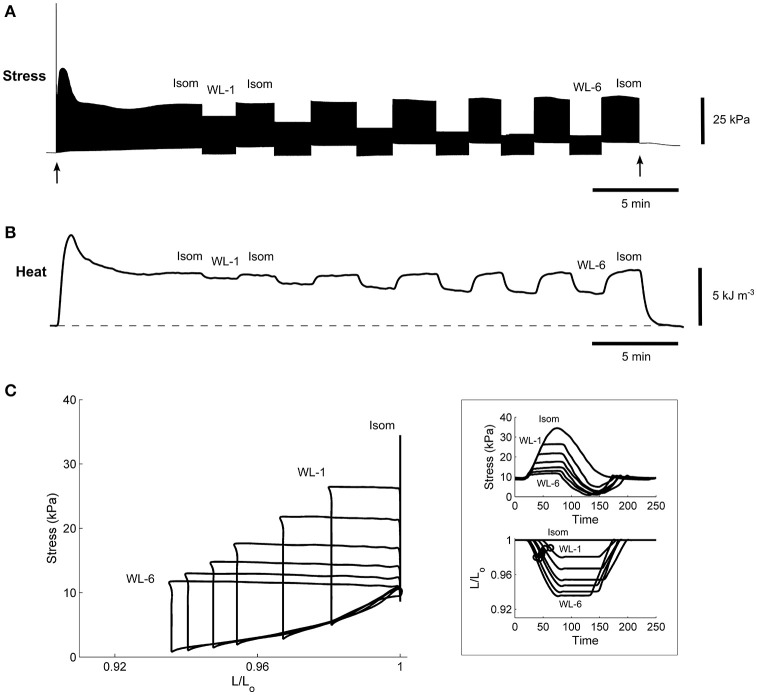
Figure 6.
A representative experimental record of a single trabecula undergoing work-loop contractions. Stimulation started at the time indicated by the first arrow and halted at the second arrow. The trabecula underwent a series of work-loop contractions at 6 different afterloads (labeled “WL-1” and “WL-6”) until steady-state (~2 min) before and after an isometric contraction (labeled “Isom”), where its stress production (A), suprabasal heat output (B), and length change (not shown) were simultaneously recorded. Steady-state work-loops resulted from plotting stress as a function of length (C). The inset in (C) shows the steady-state twitch-time profiles (upper panel) and corresponding length changes (lower panel), where the open circles indicate the maximal slopes during the shortening phase and are an index of velocity of shortening.

