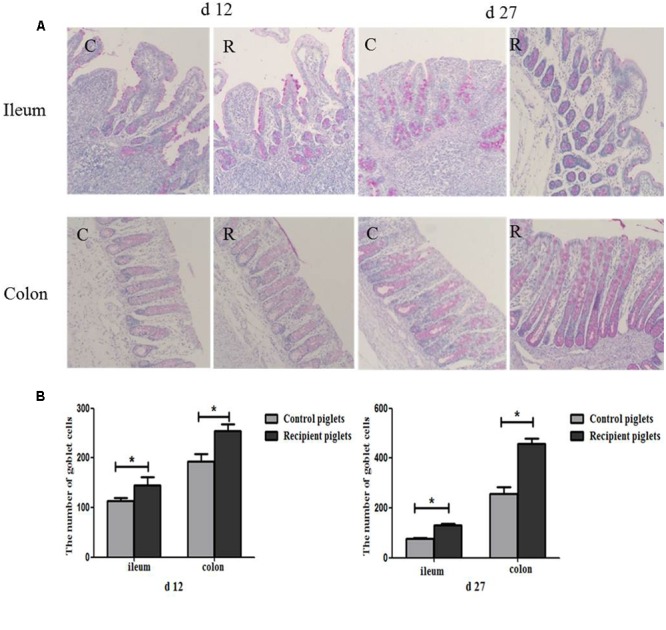
FIGURE 10.

Distribution of goblet cells in the ileum and colon mucosa of piglets orally treated with or without exogenous fecal microflora. (A) The representative figure of goblet cells (PAS staining, 200×). (B) The number of goblet cells. C, Control piglets. R, Recipient piglets. Data are expressed as the mean ± SEM. ∗P < 0.05.
