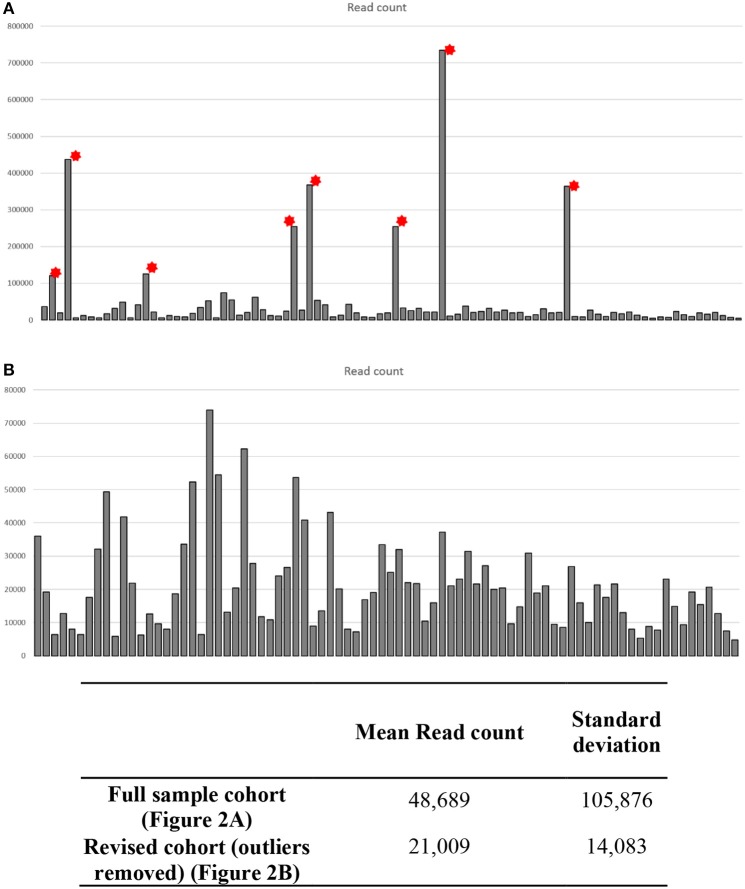
Figure 3.
Quality control data analysis across CSF small RNA sequenced samples. Each sample was ran in duplicate across two lanes of a sequencing flow cell. Chimira was used to provide an overall assessment of the miRNA expression content in each sequenced sample across the two lanes. (A) Eight samples showed read counts that were considerably higher than the remaining 82 samples (* outlier samples), these outlier samples would skew any differential expression analysis. (B) Upon removal of the 8 outlier samples each sample read count is now comparable for differential expression analysis.

