Figure 2.

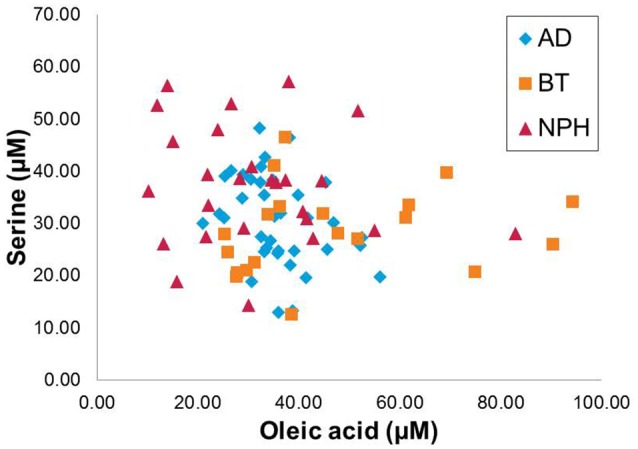
Scatter plot displaying the oleic acid and serine across the three CNS disease groups, Alzheimer's disease (AD), brain tumor (BT), and normal pressure hydrocephalus (NPH).

Scatter plot displaying the oleic acid and serine across the three CNS disease groups, Alzheimer's disease (AD), brain tumor (BT), and normal pressure hydrocephalus (NPH).