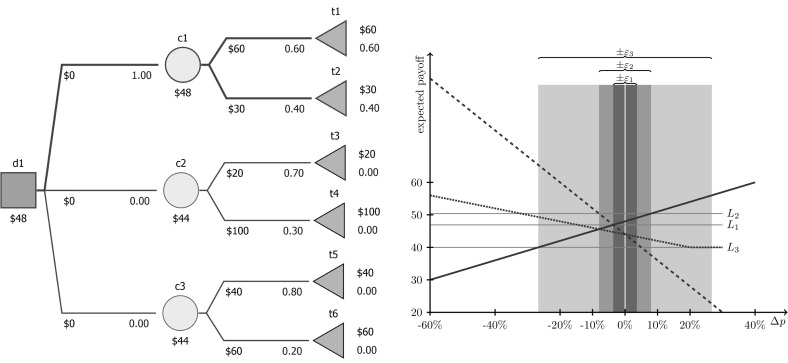
Fig. 5.
An exemplary decision tree (above) with sensitivity analysis (below) for three strategies (going to , , and represented with thick solid, dashed, and dotted line, respectively). The horizontal axis denotes the deviation in the probability of going to the upper node (, , and , respectively) independently for each strategy. is optimal for baseline probabilities, shaded regions illustrate boundaries for stability (dark), -optimality (medium), and -optimality (light). It is -optimal for all the deviations (mode-tending requires maximizing ). Gray horizontal lines drawn to help see where expected payoffs equate (observe that the expected payoff of the decision to choose c3 temains constant for as probability of t6 is equal to ). , , and

