Figure 10.
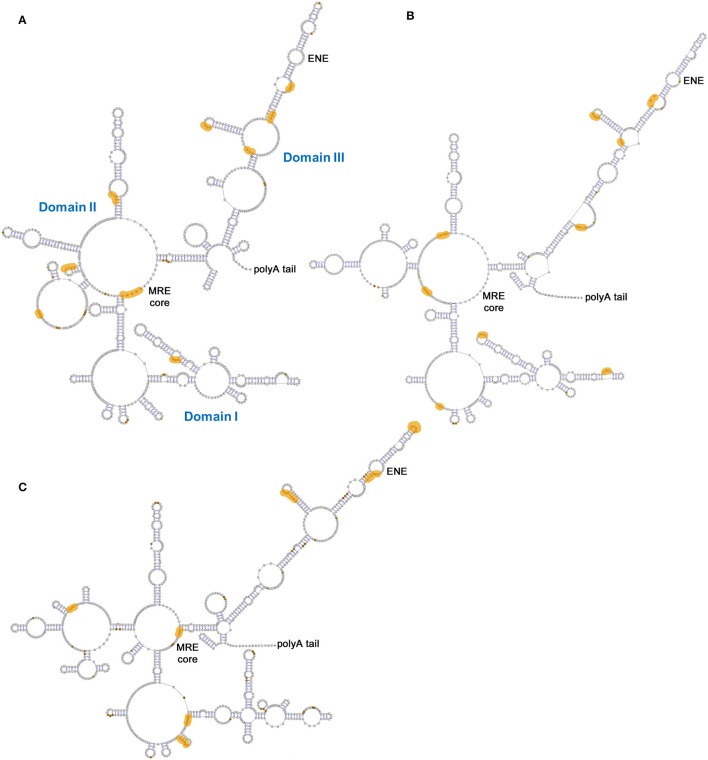
PAN RNA secondary structures and potential KSHV protein binding sites. Models generated from SHAPE-MaP experiments using PAN RNA isolated from (A) nuclei, (B) cytoplasm or (C) virions. The MRE core motif and poly-A tail are indicated in all panels, while Domains I-III are common to all three panels but are indicated only in panel (A). Orange zones reflect differences in reactivity calculated for RNA probed in- or ex-vivo that are consistent with protein binding. Adapted from Sztuba-Solinska et al. (2017).

