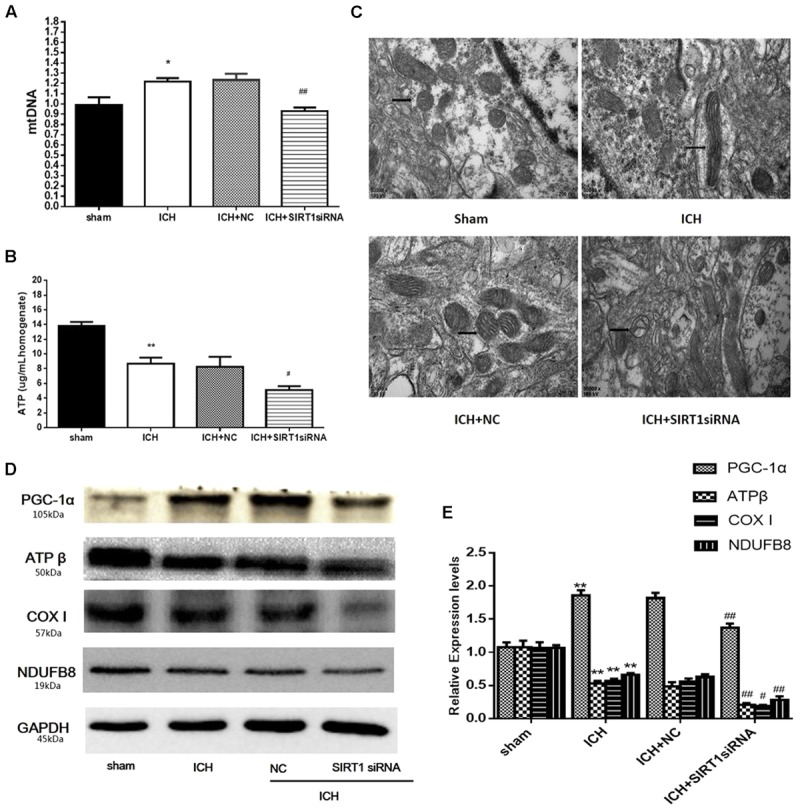
FIGURE 9.

ATP concentration, mitochondrial DNA content, mitochondrial structural and mitochondrial electron transport chain proteins changes after ICH injury following SIRT1 silencing in rats. (A) Real-time PCR of the D-loop region of mtDNA in brain tissue at 48 h after ICH. (B) Changes in ATP concentration of brain tissue at 48 h after ICH as assessed by high performance liquid chromatography with a variable wavelength detector (HPLC-VWD). (C) Mitochondrial structural changes were assessed by projection electron microscopy (50000× magnification). Arrows indicate mitochondria around the hematoma of rats with ICH. (D) Representative western blots of ATPβ, COX I, NDUFB8, and PGC-1α. Relative protein band density values were calculated as the ratio of the protein of interest to that of GAPDH. Quantification of (D) is shown in (E). Error bars represent mean ± SEM. (∗P < 0.05, ∗∗P < 0.01 vs. sham; #P < 0.05, ##P < 0.01 vs. ICH). n = 4 in the sham group, and n = 6 in the other groups.
