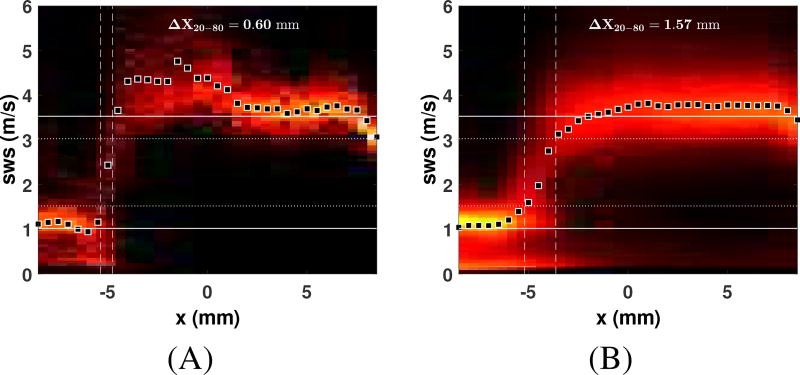
Fig. 19.
(A) Heat-map histogram of shear wave speed at each lateral position for a single track beam (θ = 1.13°, ϕ = 1.13°). The boundary at x = −5 mm is apparent with high resolution, having a 20–80% rise spacing of just 0.60 mm. (B) Heat-map histogram of shear wave speed, averaged over all track beams. The resolution of the boundary is degraded, showing a width of 1.57 mm.

