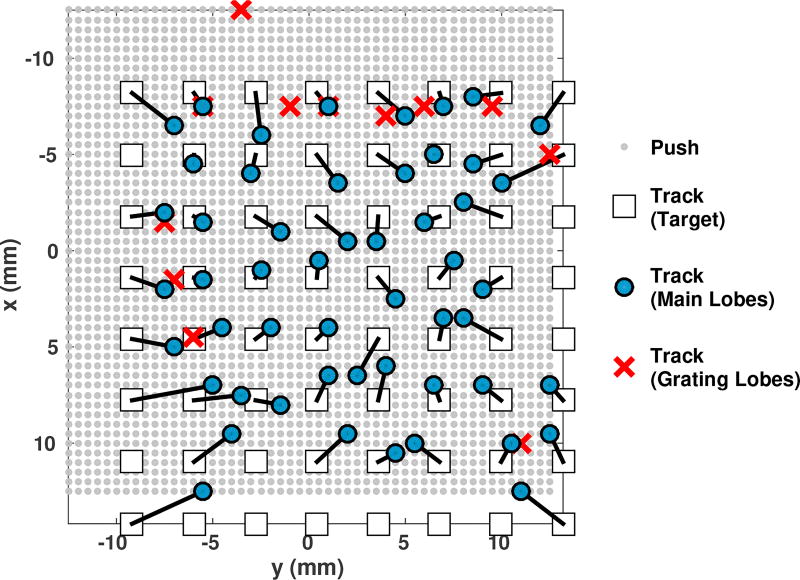
Fig. 9.
Predicted and estimated beam positions, at a depth of 4 cm. Each gray dot represents a push beam position. Each track beam is represented by a white square for the location specified by the transmit-receive delays, while the teal circle is the estimated (biased) position, based on the origin of the corresponding STL shear wave. For some track positions, the primary STL shear wave originated from a grating lobe of the tracking beam, and those locations have been marked as red “x”s

