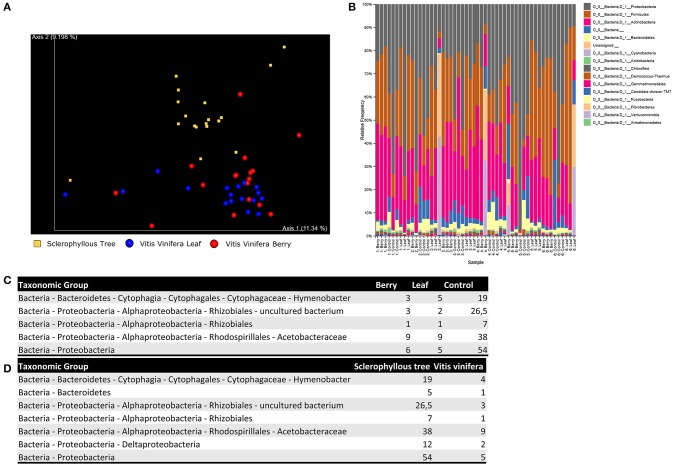
Figure 1.
Results of the metabarcoding analysis of grapevine in Chile. The study analyzes 6 vines from three Chilean geographic areas, and sclerophyllous trees from the adjacent forest area. Vines are sampled from both leaves and fruits. All analysis are replicated 3 times, leading to 54 samples, of which 36 grapevine and 18 controls. 2 samples are discarded due to quality issues. Principal coordinates analysis plot is reported to visualize relationships between samples (A). We also show the relative abundance of operational taxonomic units, assigned using QIIME feature classifier, at phylum level (B), together with the median abundance values obtained for the most significant species in the differential analysis between sampling sites (C) and plant species (D).

