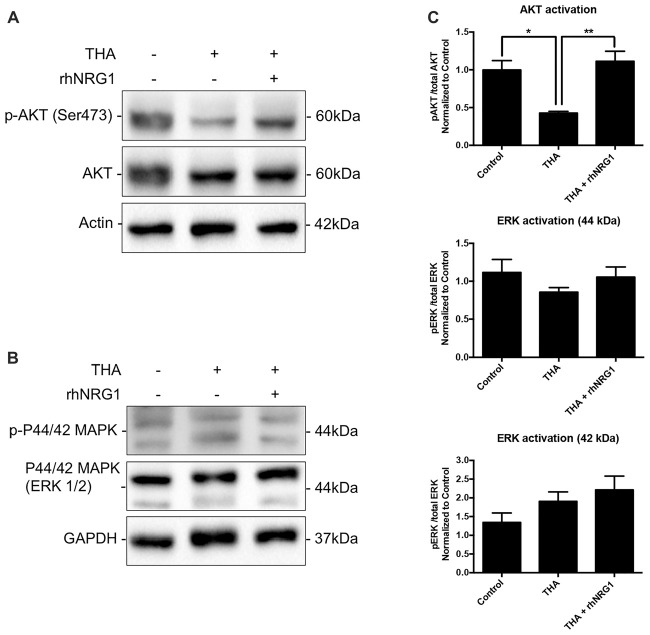
Figure 3.
Activation of downstream targets by rhNRG1. (A,C) Western blot of SCOCs revealed increased phosphorylation of AKT upon rhNRG1 treatment compared to the excitotoxic treatment alone. (B,C) No significant differences for ERK activation. Data are shown as mean ± SEM with n = 3–5 values per treatment. **p < 0.01; *p < 0.05.

