
Figure 2.
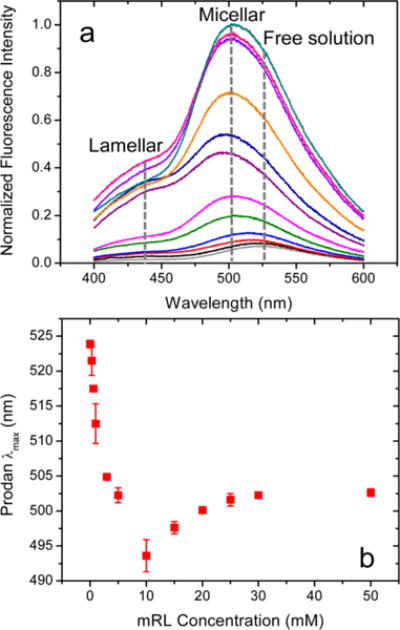
(a) Normalized prodan fluorescence spectra and (b) prodan λmax values as a function of mRL concentration at pH 8.0. Prodan concentration 250 nM; λex = 340 nm. Error bars on λmax values represent standard deviations from three independently prepared samples.