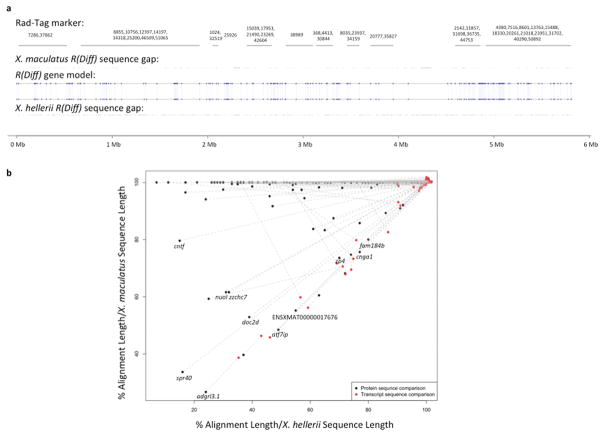
Figure 3. Sequence analysis of gene models in the R(Diff) region.
Genomic sequences of both X. maculatus and X. hellerii R(Diff) were extracted from the respective genome assemblies 24. (a) RAD-Tag markers that are mapped to the R(Diff) region are labeled with their physical location on X. maculatus R(Diff) sequences. Uncharacterized nucleotide of X. maculatus and X. hellerii R(Diff) are highlighted for both genomic sequences. X. maculatus and X. hellerii R(Diff) share the same 164 gene models (blue dots). Gene synteny is also retained between the two species. (b) Transcript and protein sequences of X. maculatus alleles and X. hellerii alleles of these 164 genes were compared to each other. Genes that showed 20% lower alignment (alignment length/X. hellerii sequence length and alignment length/X. maculatus transcript length) in protein sequence comparison (black dot) than nucleotide sequence comparison (red dot) are labeled with gene names.

