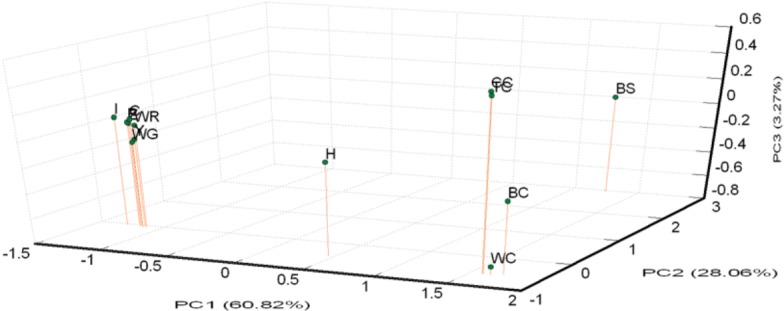
Figure 3.

Principle coordinate analysis (PCA) plot of 13 population positions by population genetic distances based on the alleles frequencies of 21 microsatellite markers (loci). The first (PC1), second (PC2), and third (PC3) principal component accounted for 60.82%, 28.06%, and 3.27% of the total variation, respectively. BC, brown Chinese geese; WC, white Chinese geese; CC, Chinese geese from private farm in Chiayi; TC, Chinese geese from private farm in Taoyuan; WG, white Grimaud geese; Z,Y,P,I,C, white Roman geese from Z,Y,P,I,C farms respectively; WR, white Roman geese; H, white Roman×white Chinese geese; BS: black swan (out-group).
