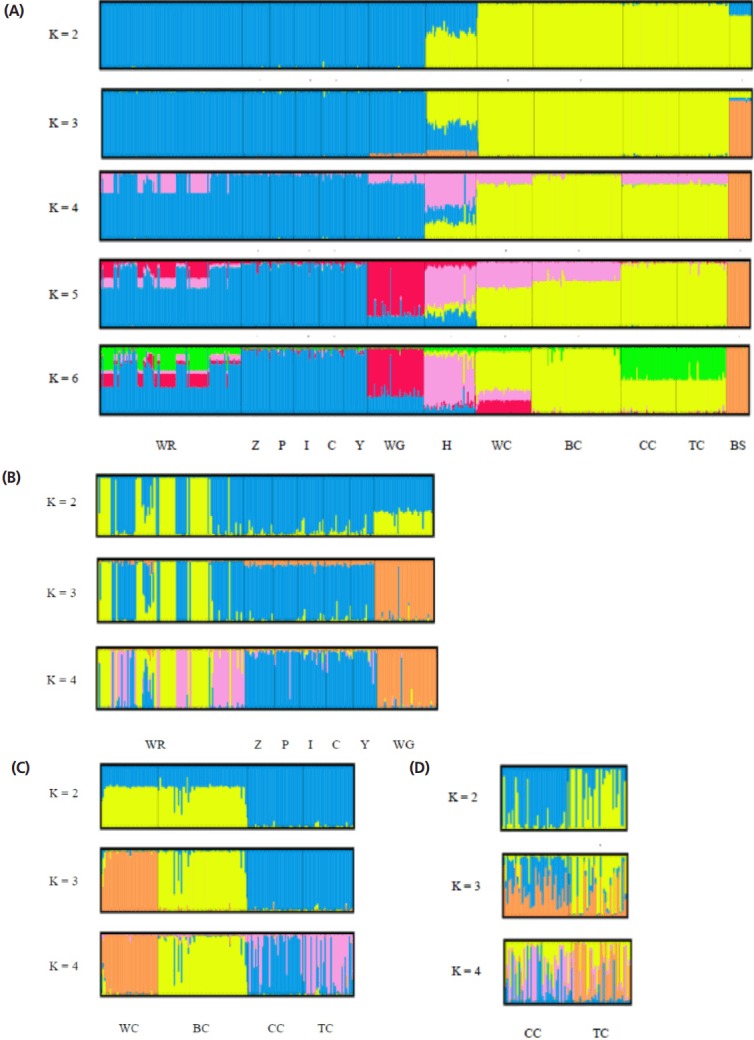
Figure 4.

Structural analyses of goose populations. Each genotyped rabbit is represented by a single vertical line divided into K colors, where K is the number of clusters assumed in each structure analysis. Each vertical bar represents an individual rabbit. The colors on a vertical bar represent the probability that an individual belongs to that cluster. (A) Cluster results from a structural analysis of 457 geese from 13 populations (based on 21 microsatellite markers). Even though K>6, there was no new cluster appearance and the figures were not too different. (B) Clustering analyses of white Roman and white Grimond geese. (C) Clustering analyses of Chinese goose populations. (D) Clustering analyses of private Chinese goose populations. WR, white Roman geese; Z,Y,P,I,C, white Roman geese from Z,Y,P,I,C farms respectively; WG, white Grimaud geese; H, white Roman×white Chinese geese; WC, white Chinese geese; BC, brown Chinese geese; CC, Chinese geese from private farm in Chiayi; TC, Chinese geese from private farm in Taoyuan; BS: black swan (out-group).
