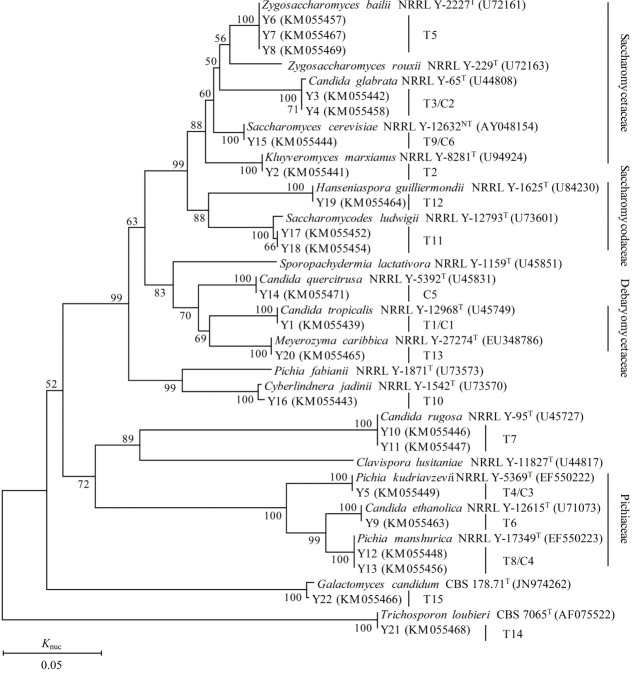
Figure 5.
Phylogenetic tree drawn from neighbor-joining analysis of the 26S rRNA gene D1/D2 domain sequences, depicting the relationships of the isolated yeast species with closely related taxa. The bootstrap values for a total of 1,000 replicates are shown at the nodes of the tree. Trichosporon loubieri was used as an out-group. The bar indicates 5% sequence divergence. The GenBank accession no. of each type strain D1/D2 region 26S rRNA gene is shown behind the type strain. Knuc, nucleotide substitution rates.

