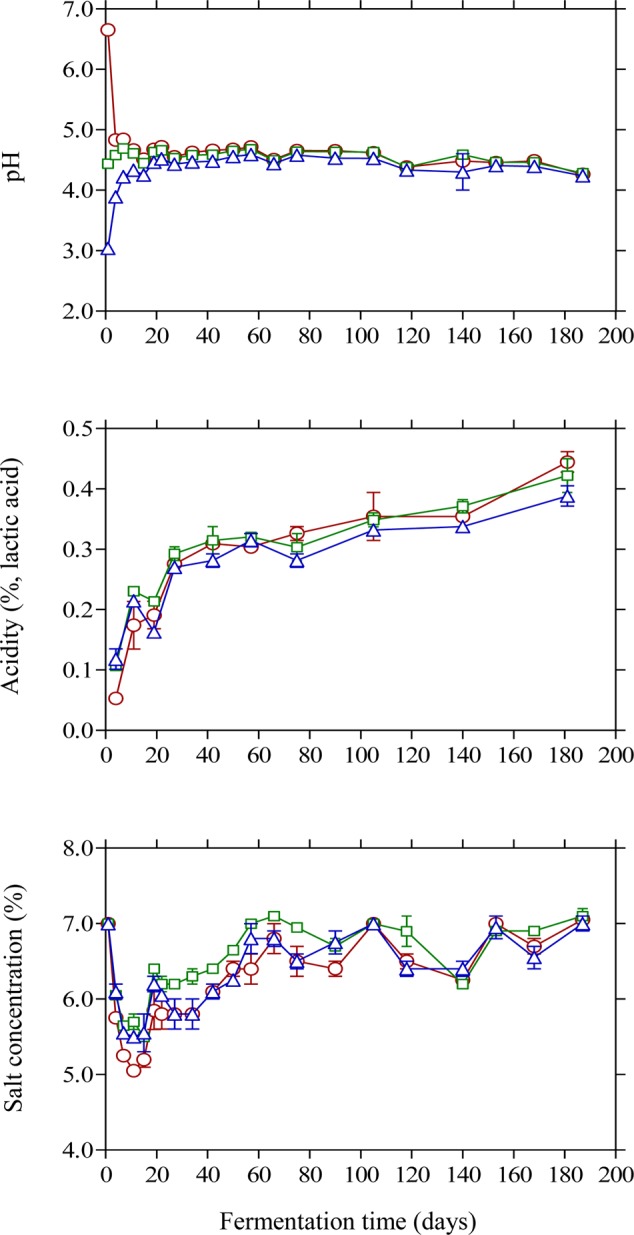
FIGURE 2.

Changes in pH, titratable acidity and salt concentration in the brines of Kalamata natural black olives during spontaneous fermentation with different initial acidification treatments. (○) without brine acidification (control); (□) brine acidified with 0.5% (v/v) vinegar; (△) brine acidified with 0.1% (v/v) lactic acid. Data points are mean values of duplicate fermentations ± standard deviation.
