Figure 2.

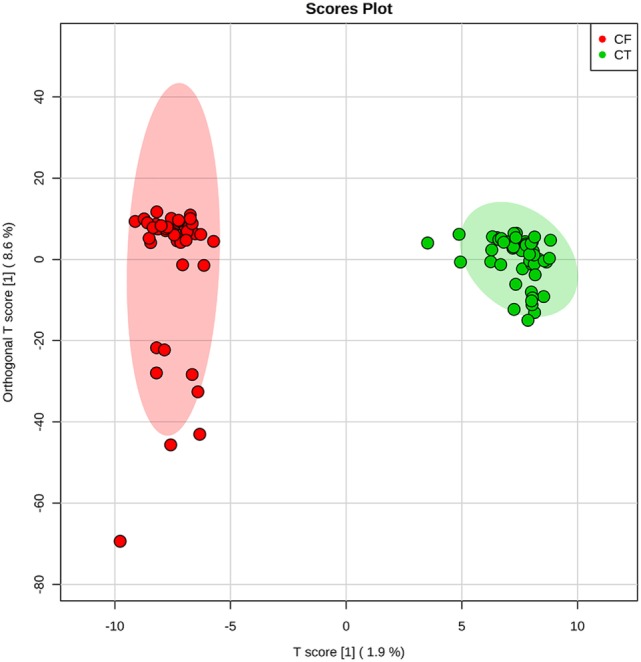
Two-dimensional plot provided by Orthogonal Partial Least Squares Discriminant Analysis. It is possible to observe a clear separation between control (CT) subjects and patients with cystic fibrosis (CF).

Two-dimensional plot provided by Orthogonal Partial Least Squares Discriminant Analysis. It is possible to observe a clear separation between control (CT) subjects and patients with cystic fibrosis (CF).