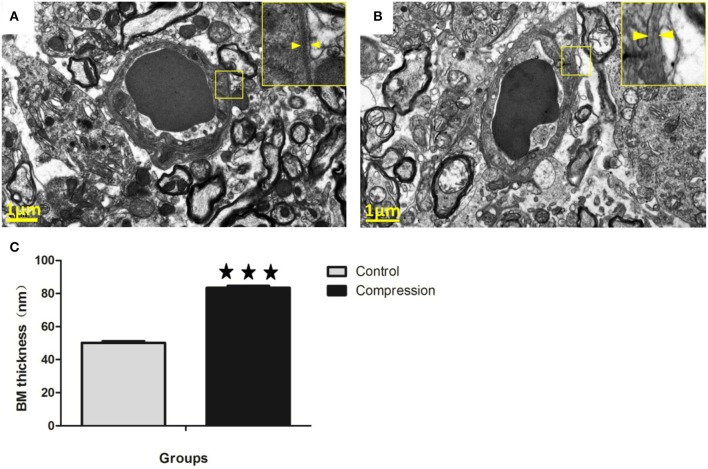
Figure 10.
In the control group, microvessels were encapsulated with a thin BM (A). In the compression group, the BM was thickened considerably, but with lower electron density (B). Histograms show that BM thickness significantly increased in the compression group (C). The number of capillaries analyzed per group was 30, sampled from 12 rats per group. ***P < 0.001 relative to controls.

