Figure 4.
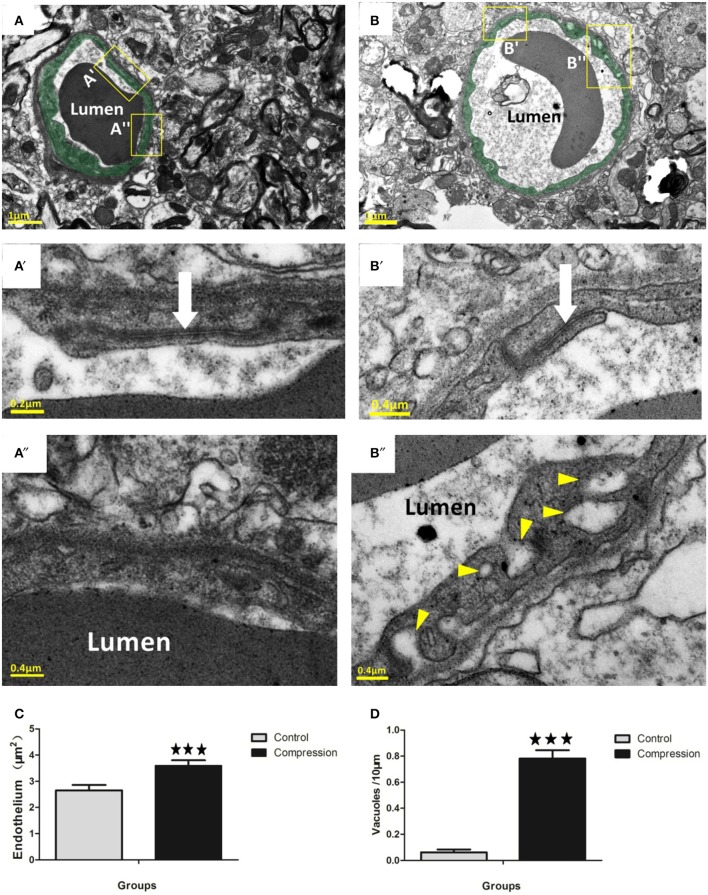
Electron micrographs (EMs) of capillaries in the control group (A). Endothelium is lightly shaded as green (A,B). Insets (A′, A″) below the image shows a relatively thin endothelial layer (A″) and intact TJs (white arrow in A′). EMs of capillaries in the compression group (B). Insets (B′,B″) show that the slightly swollen endothelium was densely packed with putative caveolae-like vesicles (arrowheads) on the luminal and abluminal sides. Several TJs in the compression group (white arrows in B′) were still intact. Histograms show that endothelial thickness (C) and vacuole formation (D) were significantly increased in the compression group. Vacuoles are expressed as vacuoles per 10 mm of the vascular endothelium circumference. The number of capillaries analyzed per group was 30, sampled from 12 rats per group. ***P < 0.001 relative to controls.

