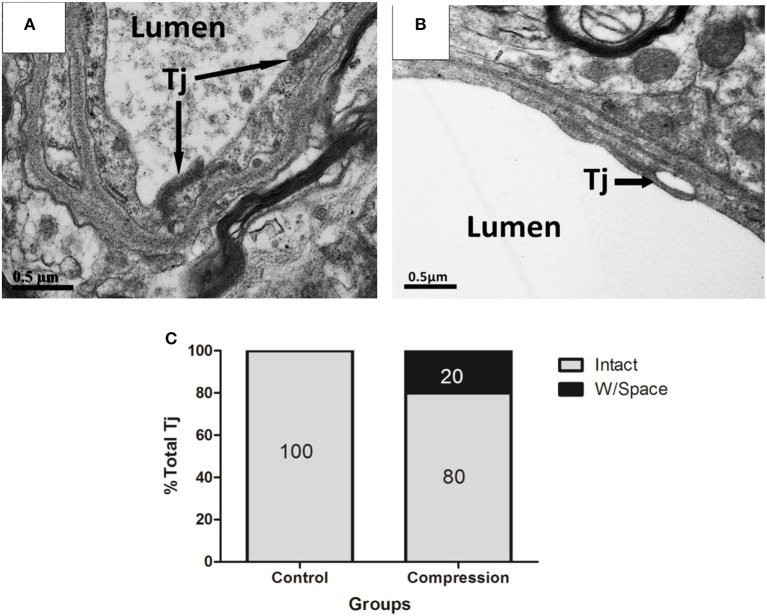
Figure 5.
EMs of TJs in ECs from control (A), and compression group (B). Structurally abnormal TJs that contain large gaps (black arrows) within compressed regions (B). Histogram shows the percentage of intact TJs in the two groups (C). Percentages were based on the analysis of 30 TJs from 12 rats per group. Tj, tight junction.

