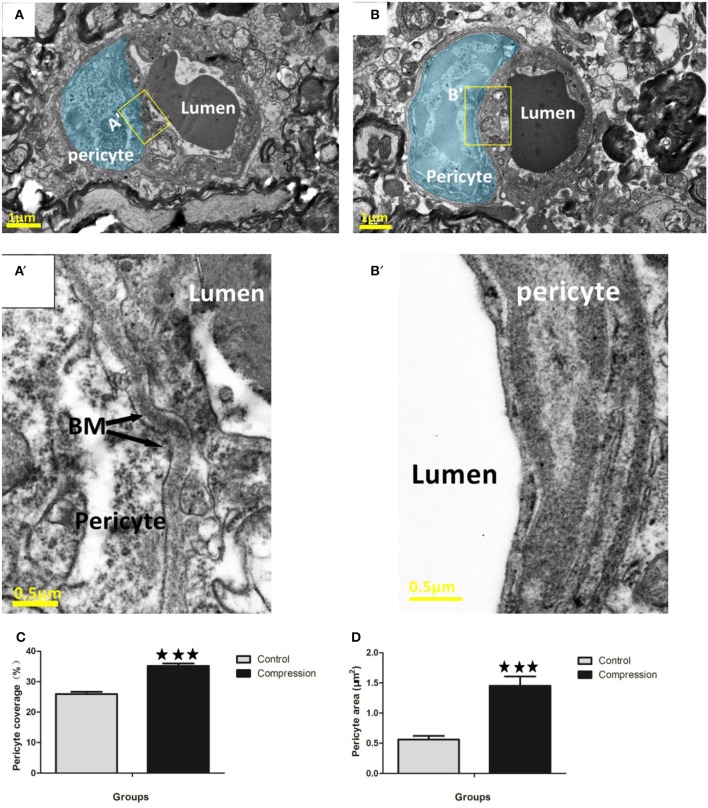
Figure 6.
EMs of microvessels in the control group (A,A′), and corrugated BM (A′). Pericytes are highlighted in blue (A,B). Pericyte processes appeared slightly swollen (B,B′), and smooth BM were detected in the compression group. Quantitative analysis indicated that pericyte coverage of the endothelium (C) and cross-sectional area (D) increased significantly in the compression group. The number of capillaries analyzed per group was 30, sampled from 12 rats per group. ***P < 0.001 relative to controls.

