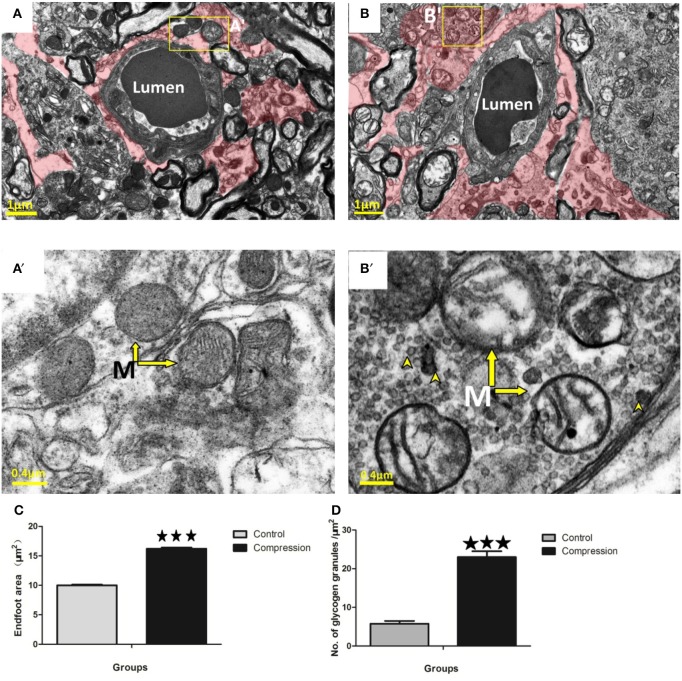
Figure 7.
EMs of perivascular astrocytes (shaded in red) in the control group (A) and compression group (B). Mitochondria (arrow) with normal appearance in control astrocytes (A′) or swollen mitochondria with disorganized or absent cristae in the compression group (B′). Notably, astrocytes in the compression group were conspicuously packed with glycogen granules (see arrowheads in B′,D). Astrocyte endfoot area increased considerably after compression (C). The number of glycogen granules per μm2 in the astrocytes increased significantly (D). The number of capillaries analyzed per group was 30, sampled from 12 rats per group. M, Mitochondria; ***P < 0.001 relative to controls.

